Data Set 1
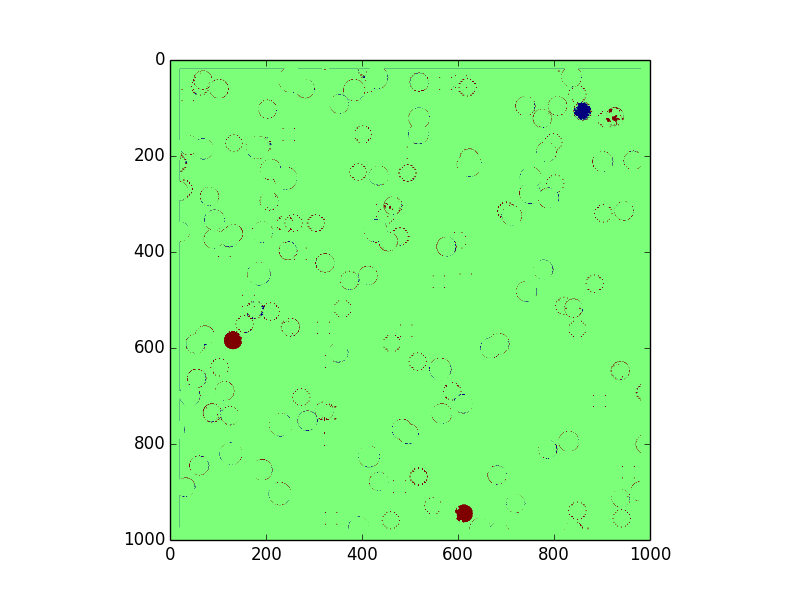
False positives: 3934 = 2.02674854717 %
False negatives: 9213 = 1.14319961881 %
Total error: 13147 = 1.3147 %
Link to Github repo
Link to competition wiki
The purpose of this project is to find safe landing sites for a lander on Mars. For more detail on the rules, constraints, and data files, please visit the above link to the competition's wiki.
The team running this competition provided us with 4 sets of training data, with 4 files in each dataset. Our solution only uses the Digital Elevation Map (DEM) from each of these datasets, which is given in .pgm format. This is a 500 by 500 grid of heights in meters, with a resolution of 0.2 m/pixel.
As output, our code is expected to output a 1000 by 1000 grid of integers designating whether each particular position is a safe landing site, supposing the center of the lander is at that particular point. The solution should be stored in a pgm format. In the solution, 0 means a location is not a safe landing site and 255 means a location is a safe landing site.
In order to understand what a safe landing site is, we first need to understand what the lander looks like. The lander is circular. It has a 3.4 m diameter base plate, with 4 footpads located at 90° intervals around the edge of the base plate. Each footpad is circular and 0.5 m across. The ground clearance of the belly is 0.39 m.
There are two main constraints defining what constitutes a safe landing site, slope and roughness. The lander cannot safely land on a location of extreme slope, as it will be unstable and may slide or flip over. The threshold for slope is predefined as 10°. The lander also cannot land on a location deemed too rough, meaning there must not be any rock or land formation under the belly of the lander that is tall enough to penetrate the base plate. This means there cannot be any rocks taller than 0.39 m.
The naive solution would assume we need to check every possible set of 3 landing points for the footpads of the rover, which would be at least the the circumference of the rover divided by average length in meters of a pixel in the DEM. Realistically, it would probably need to check more points to account for all possible positions where the tangent to the circle is not vertical or horizontal. This means checking at least 54 points. Our solution only checks 16 points, so we cut out at least 70% of the runtime that way.
We also chose to calculate the slopes using the plane normals, taking advantage of (and also optimizing for) the fact that the rover has 4 discreet footpads, rather than calculating the gradient of the plane or calculating the gradient at the central point. Calculating the gradient of any plane is slower than finding its normal, so avoiding that in general is preferable. Further, calculating gradient at the central point would be inaccurate due to the nature of the problem - the rover is landing on footpads around its edges, not a single leg in the middle.
We define the naive solution to be iterating over each point in the DEM, calling getCircleIndices with c = the current point, and checking if any of those points are taller than any of the planes formed by 3 of the border points. Assuming this checks a constant number of angles A to find the border points, getCircleIndices returns C points, and the DEM is size NxN, the naive solution would run in time O(ACN2), which simplifies to O(N2).
Our runtime in practice is much lower because we check if each point is the point of roughness, rather than if each possible circle contains a patch of roughness. We only call getCircleIndices if a point is rough, so the runtime is dependent on X, the number of points of that are raised/rough. We know X < N2 and A is a large integer, so O(N2 + CX) < O(ACN2). However, because A and C are constants, our worse case runtime simplified is O(N2 + X).
Real runtime is inversely proportional to the amount of slope in the given terrain. This is not reflected in O(N^2 + X) because the worst case remains the same no matter how much slope there is. Our code breaks out of the loop checking for slope at a given point once it knows the point is sloped, which only affects big-Omega and Theta. Further, because the getCircleIndices function used in our roughness calculations runs faster when more of the points being checked in the circle have been set to 0, our roughness calculation also runs faster when more points have been blocked out due to slope.
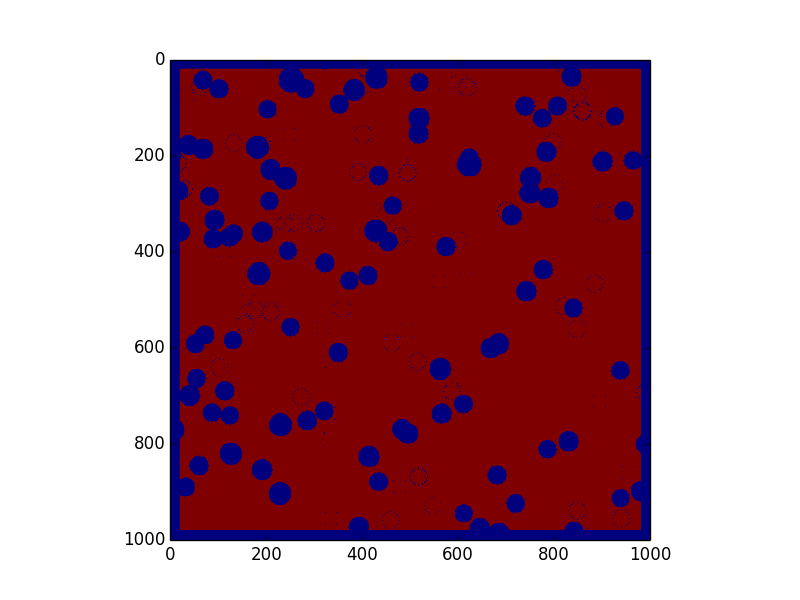
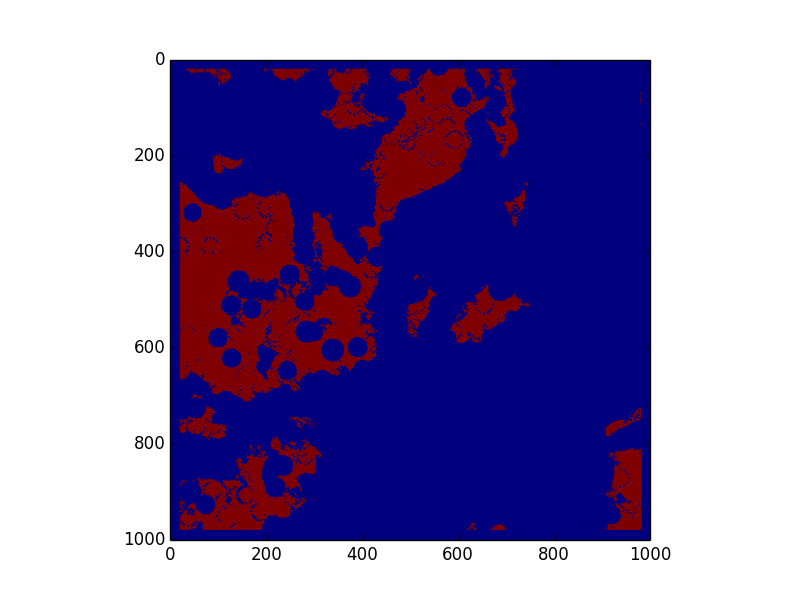
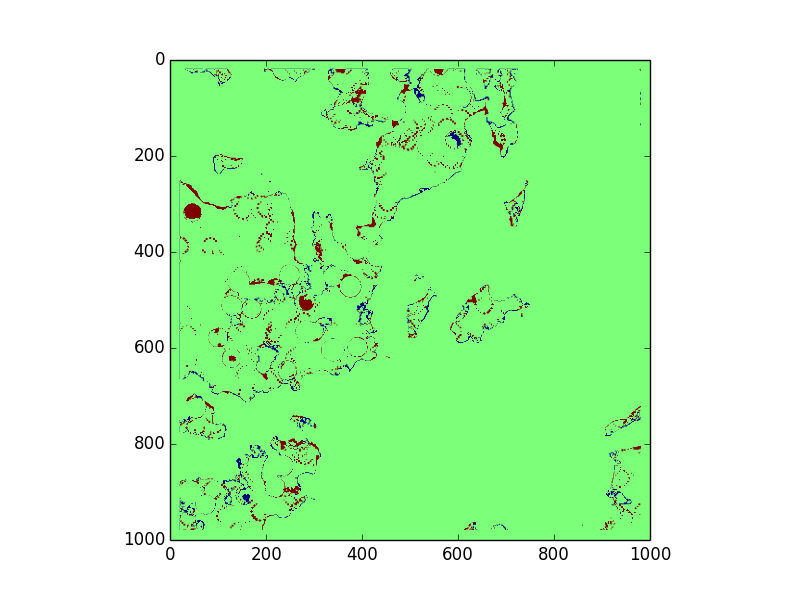
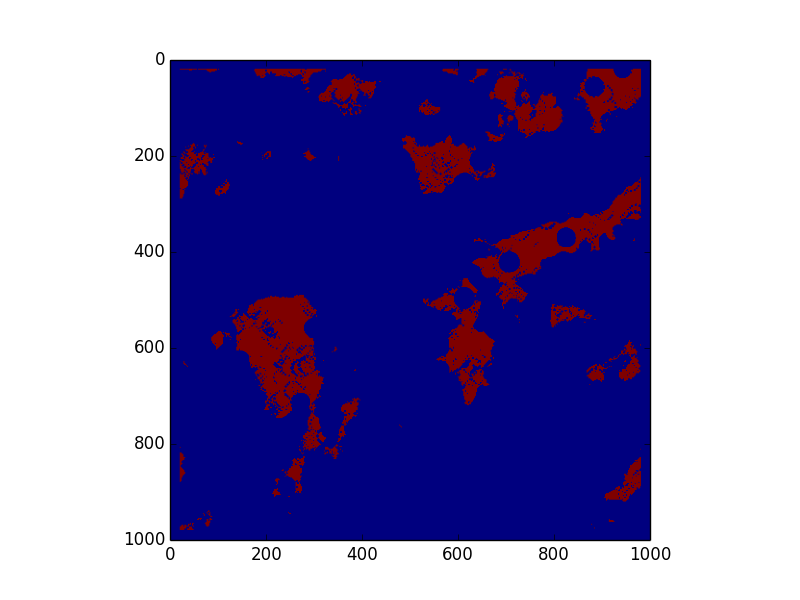
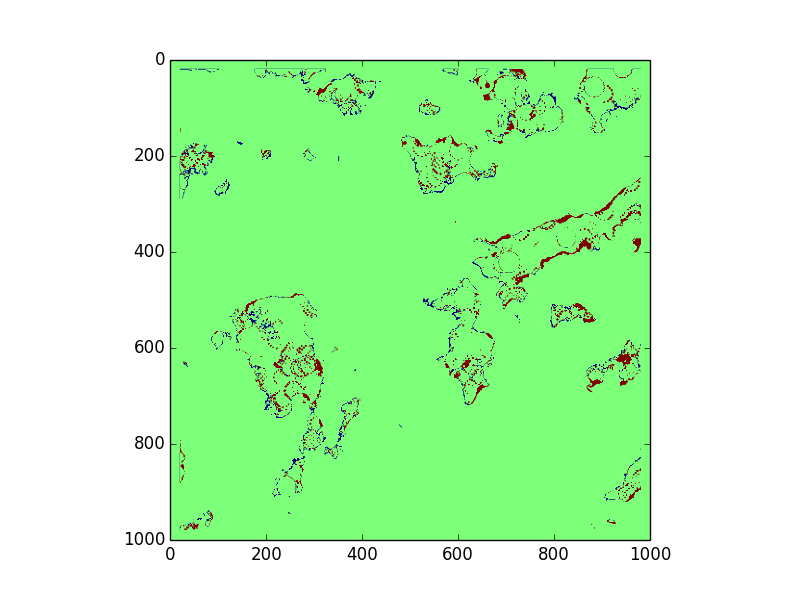
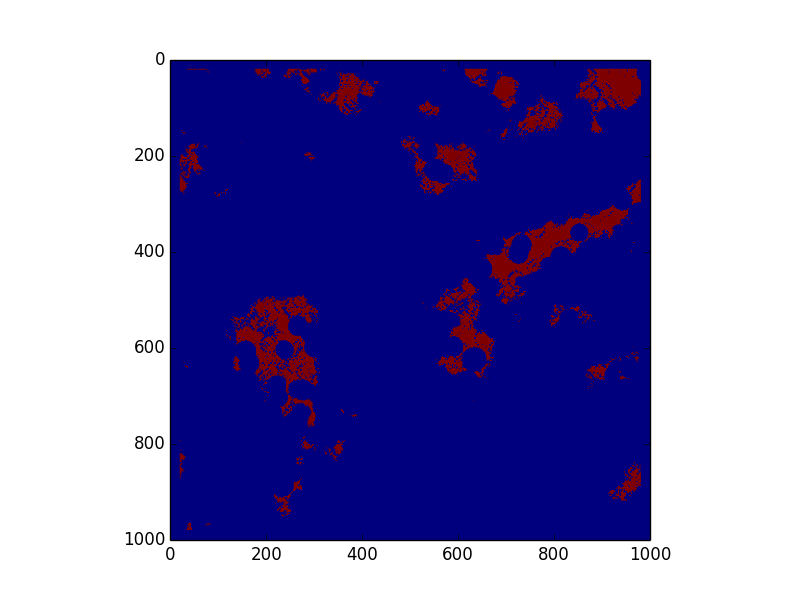
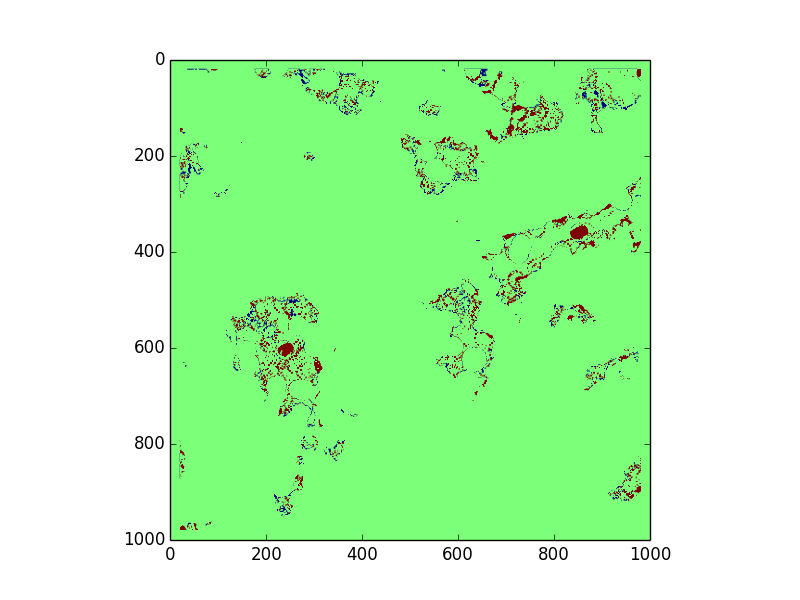
We have the solution outputed by our algorithm on the left. On the right, we have the difference between our solution and the real solution. We are using the default colors from matplotlib, so on the left, red = 255 and blue = 0. On the right, green = correct, red = false negative, and blue = false positive. We especially want to avoid false positives, or incorrectly labeling an unsafe zone, because that could lead to catastrophic failure, whereas a false negative would only mean artificially limitted options.
The choose our threshold values, we ran grid search over a range of possible values for constants a and r to minimize average total error.
Optimal values:Competition day was April 25, 2015, and this submission took 3rd place. Thanks to NASA and the Jet Propulsion Lab for the data and this great opportunity!