Link to code and image library
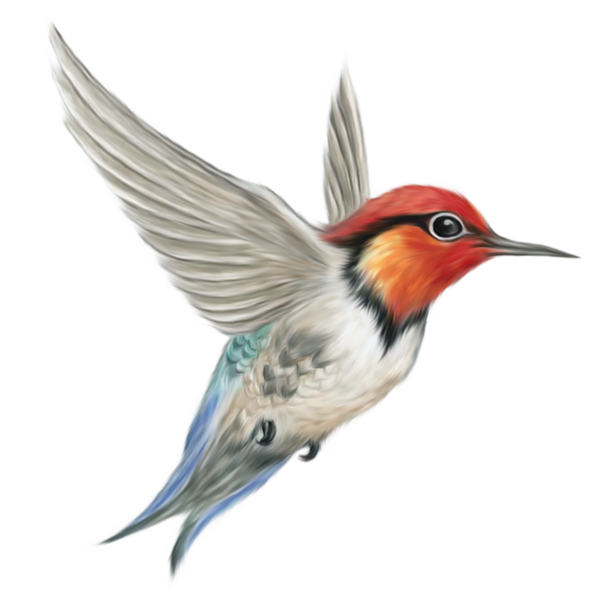
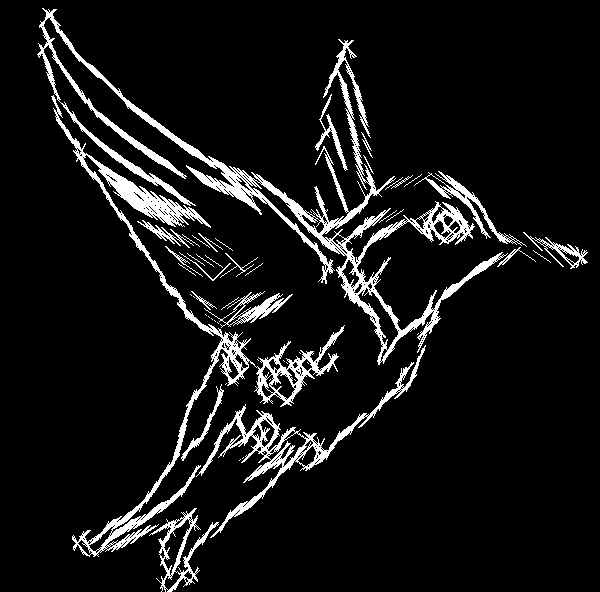
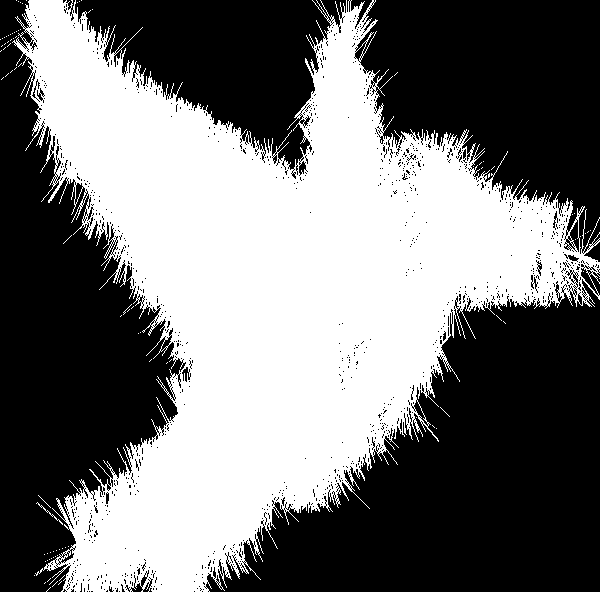
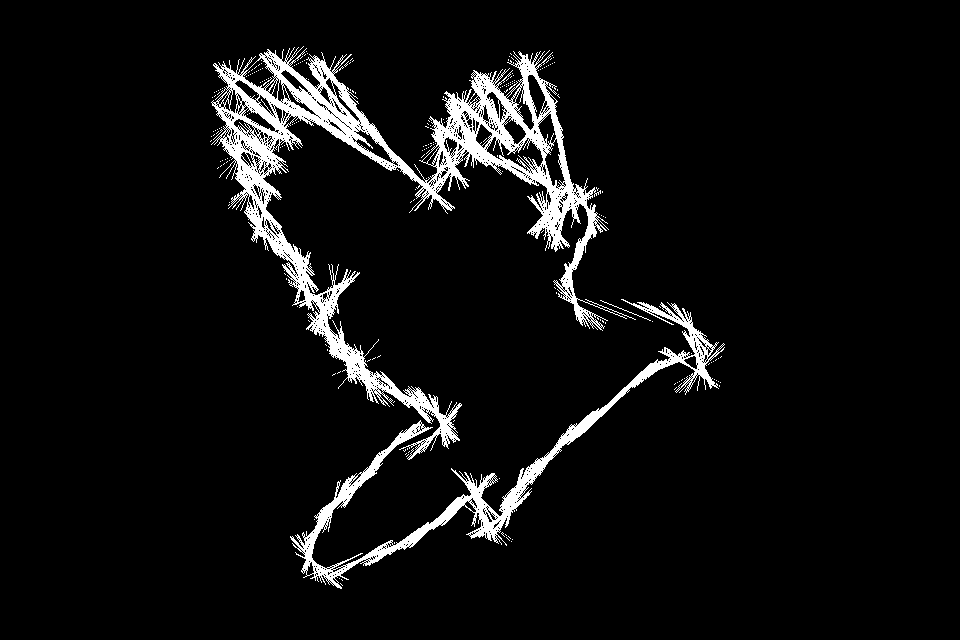
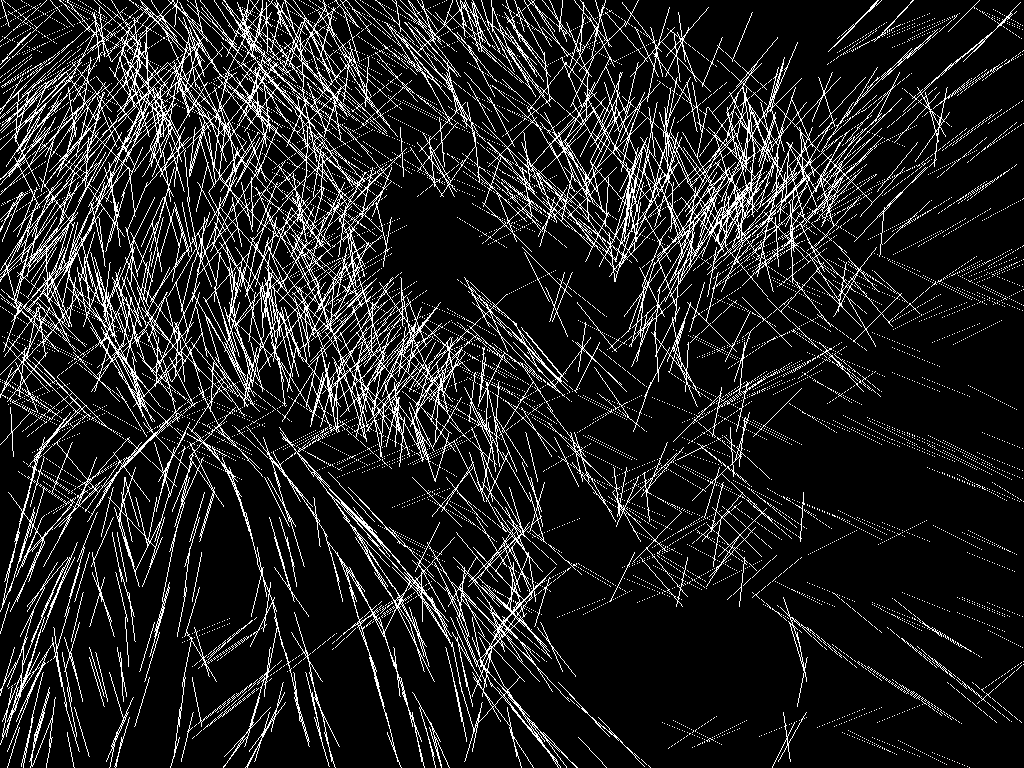
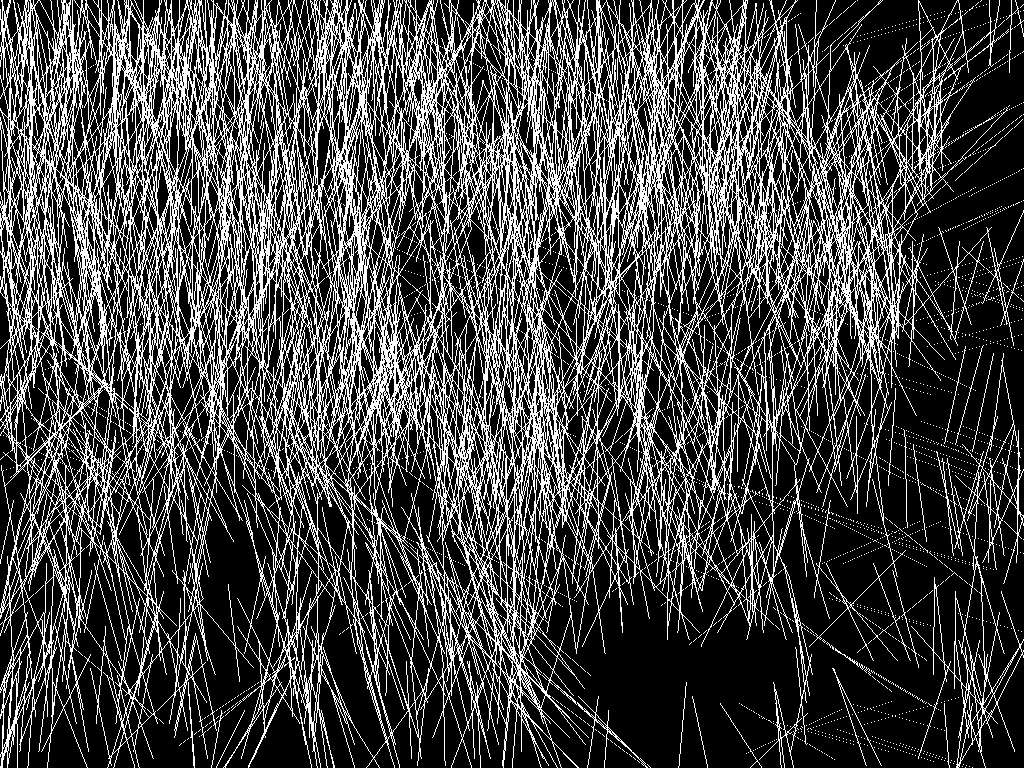
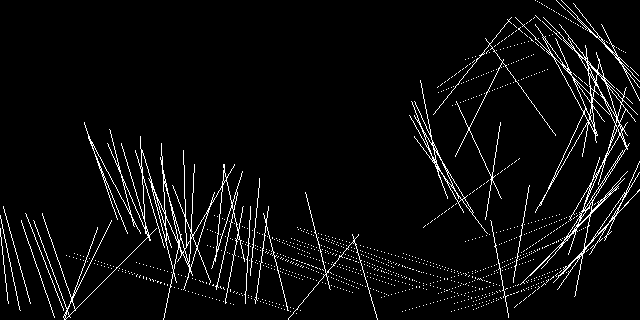
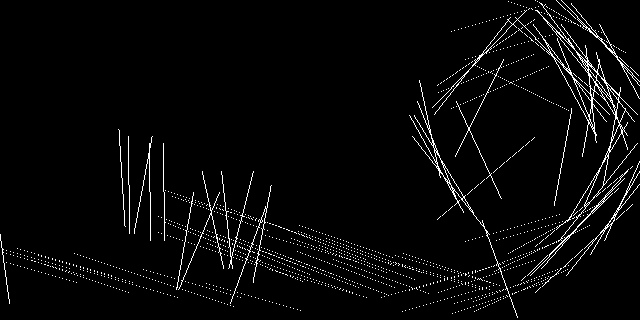
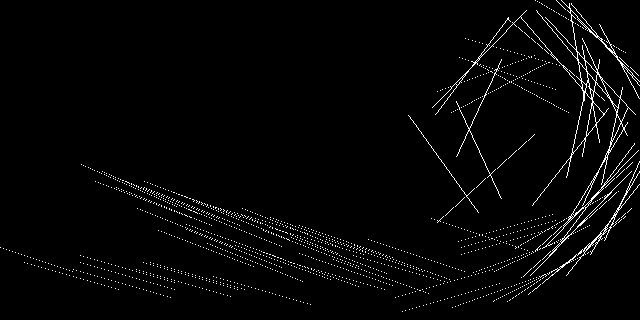
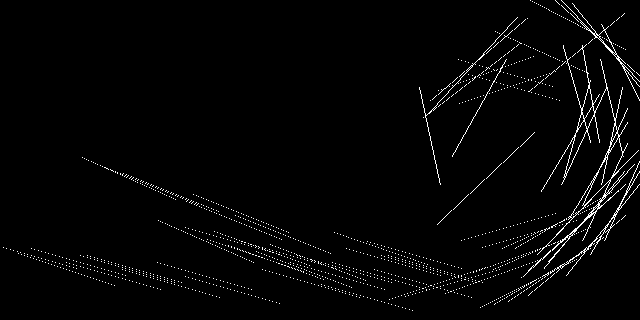
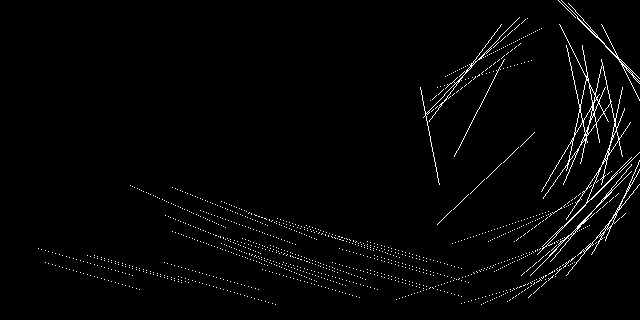
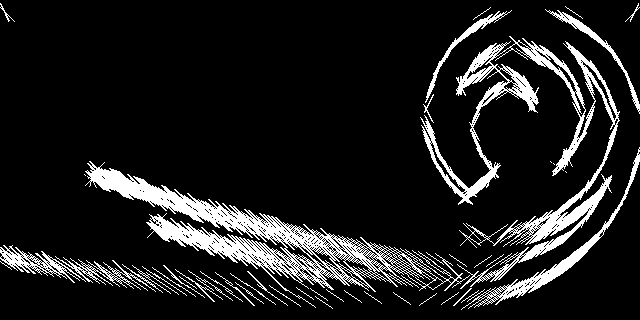
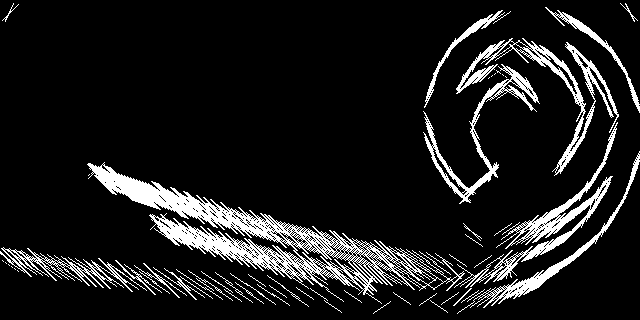
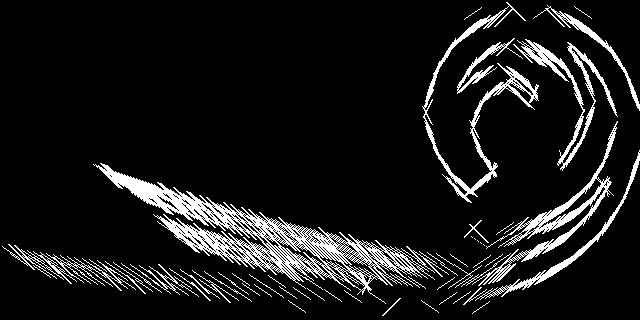
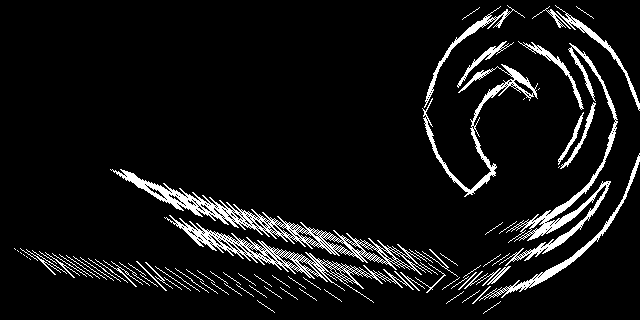
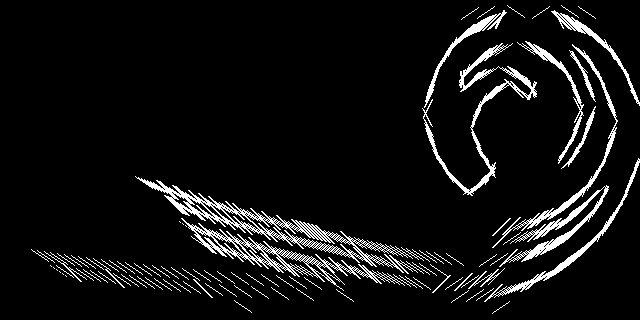
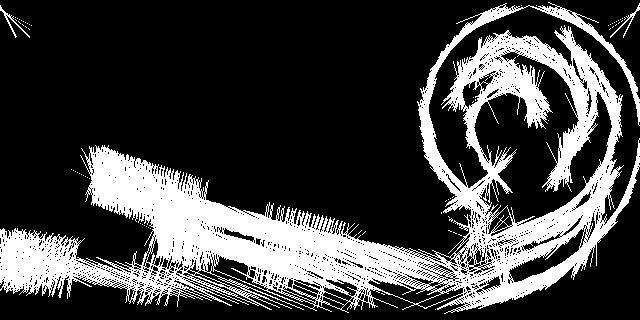
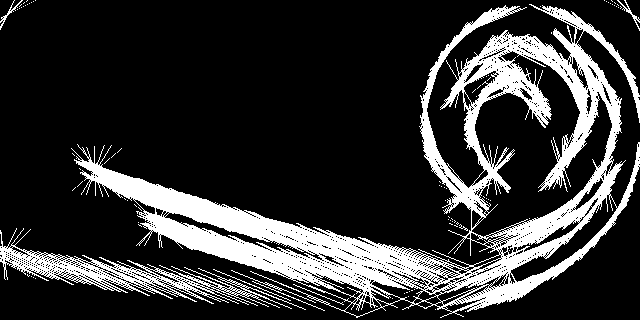
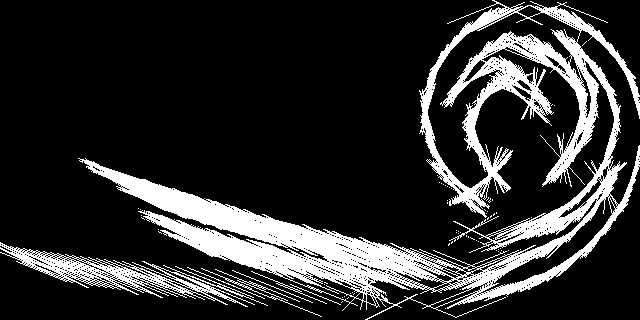
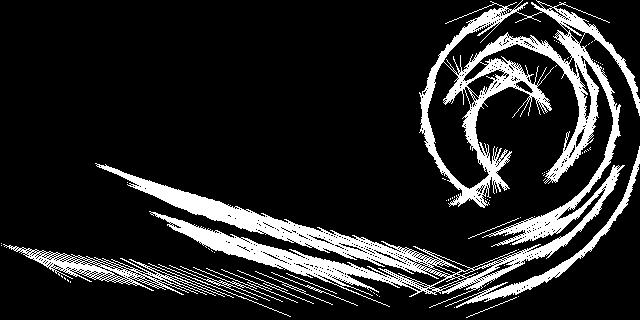
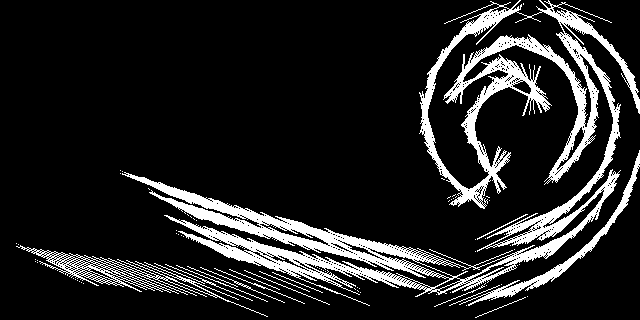
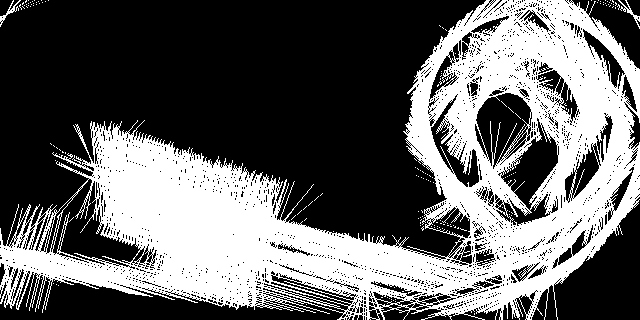
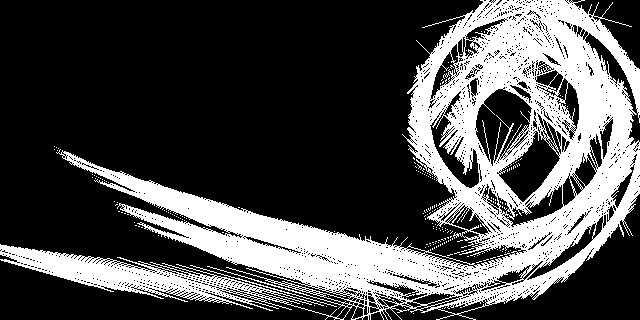
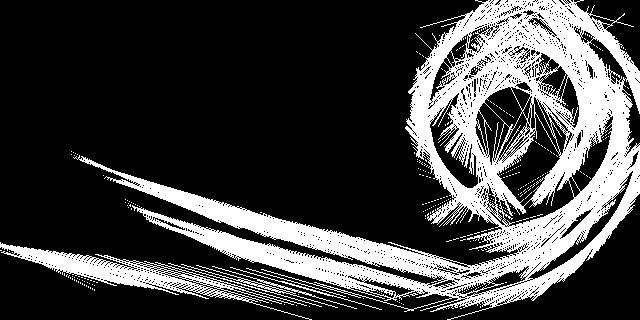
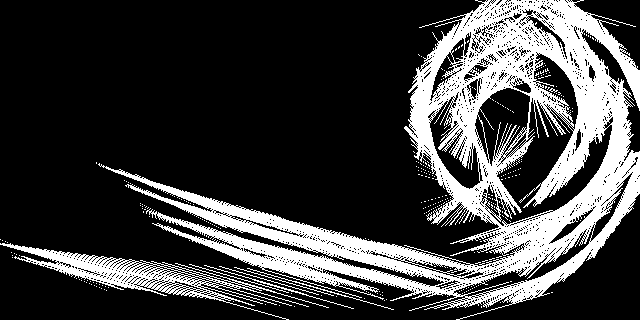
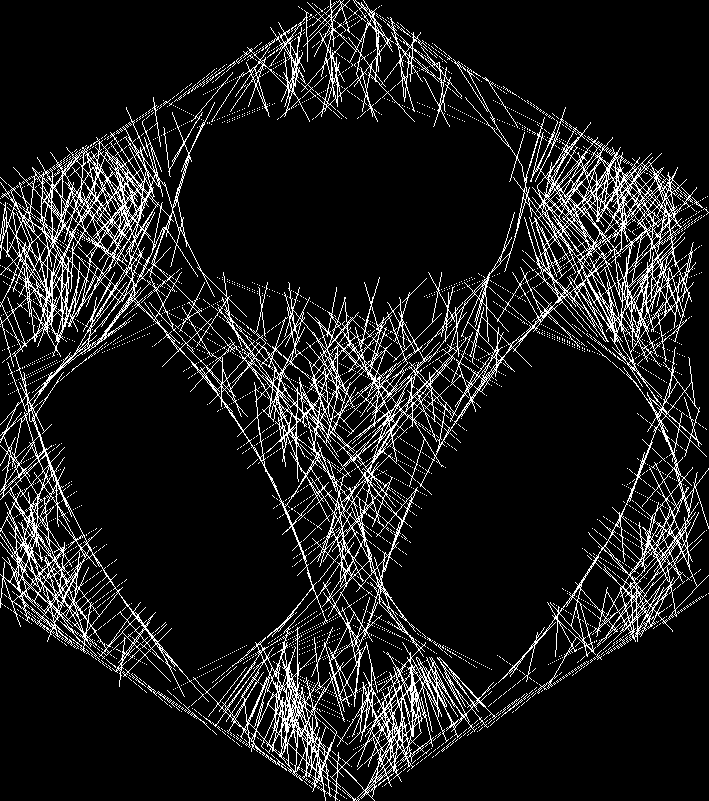
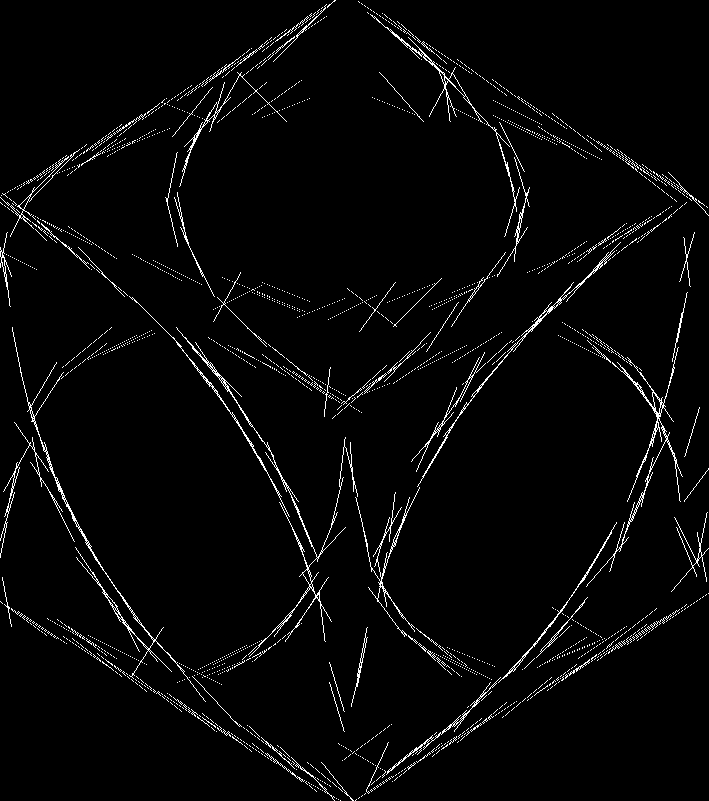
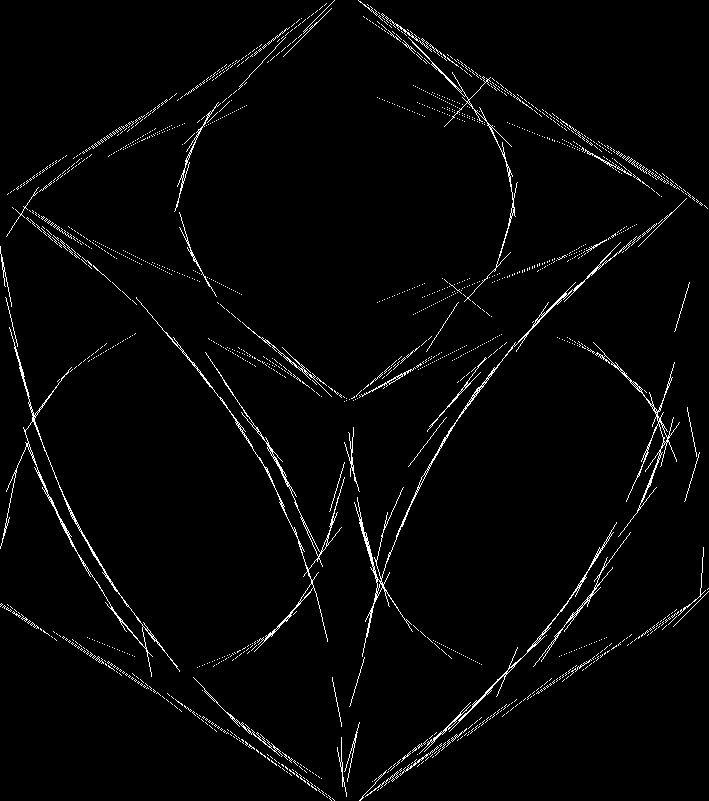
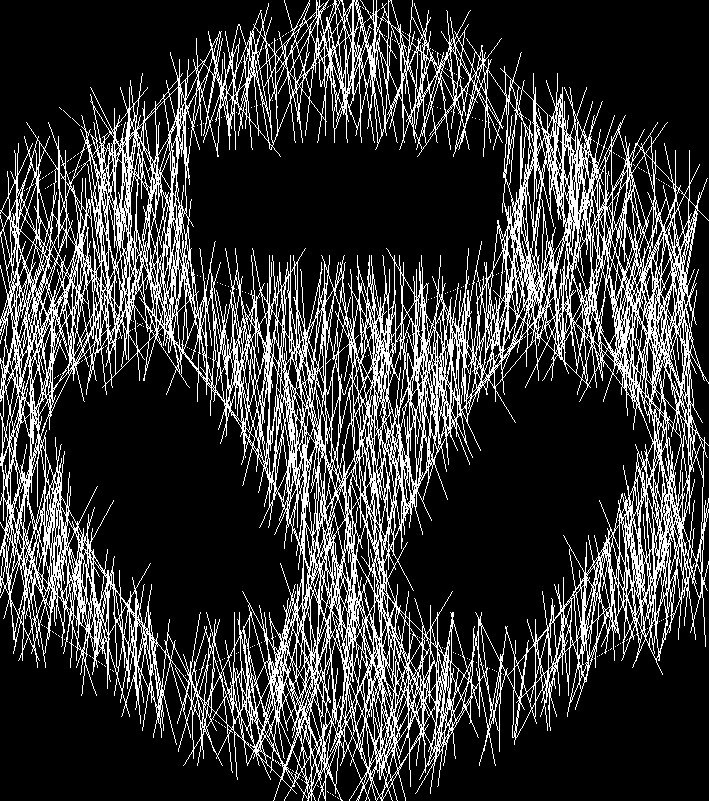
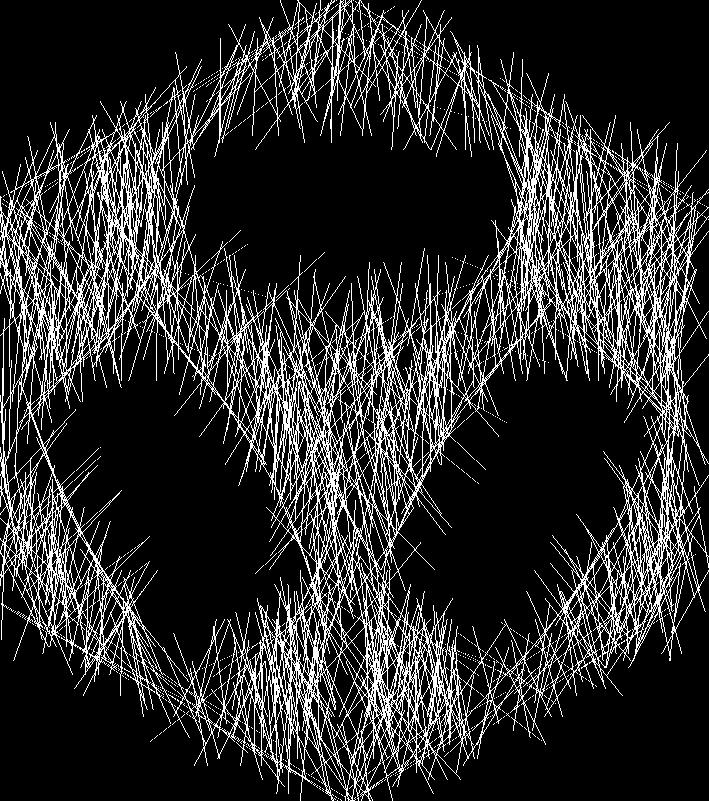
This is a very simple algorithm for converting images to a set of linear line segments. Below we will see how we can use it to make abstract bird art.
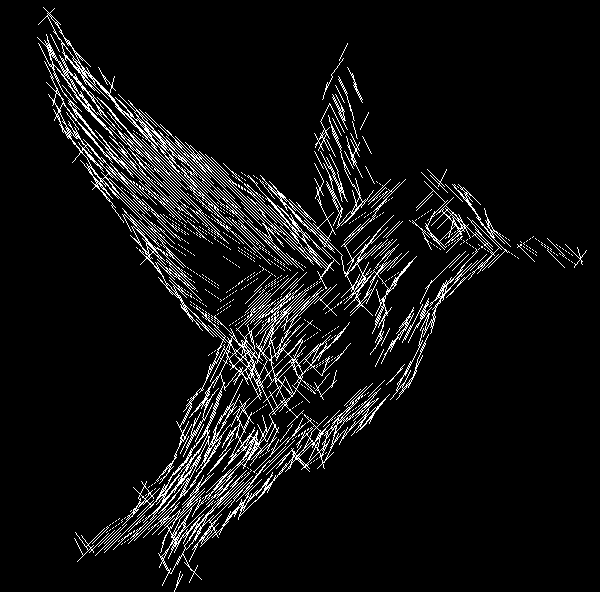
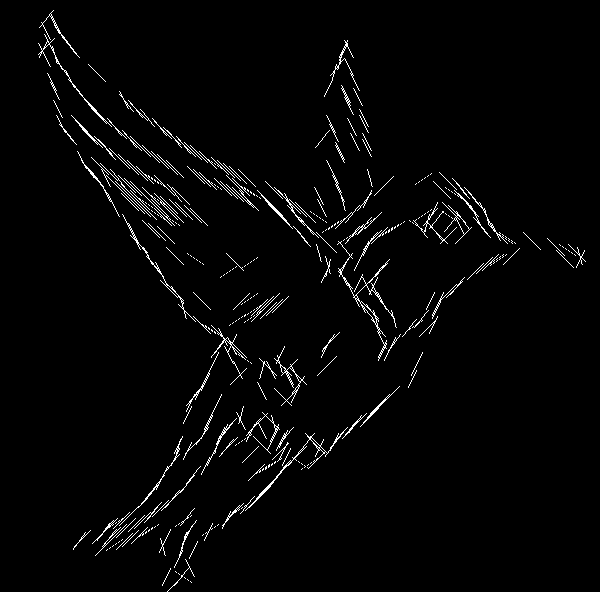
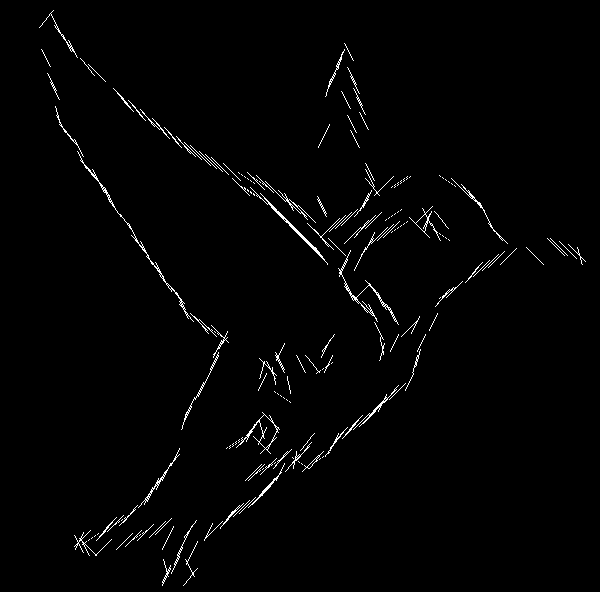
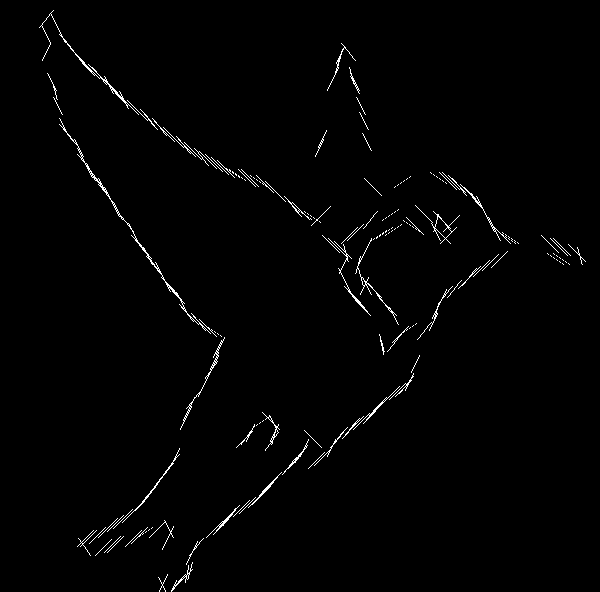
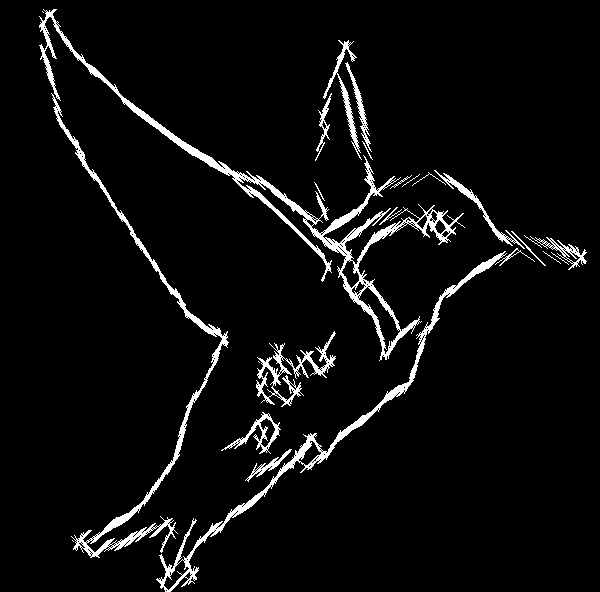
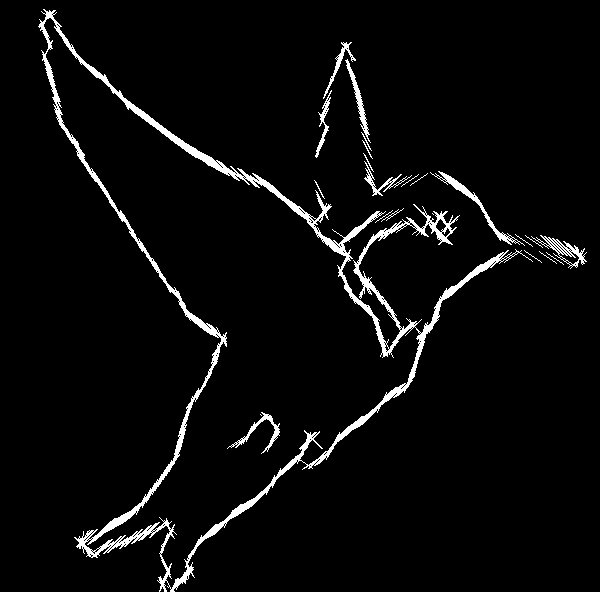
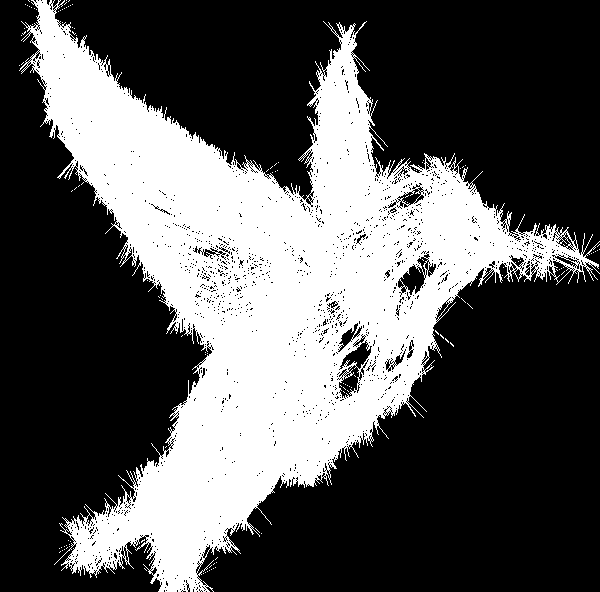
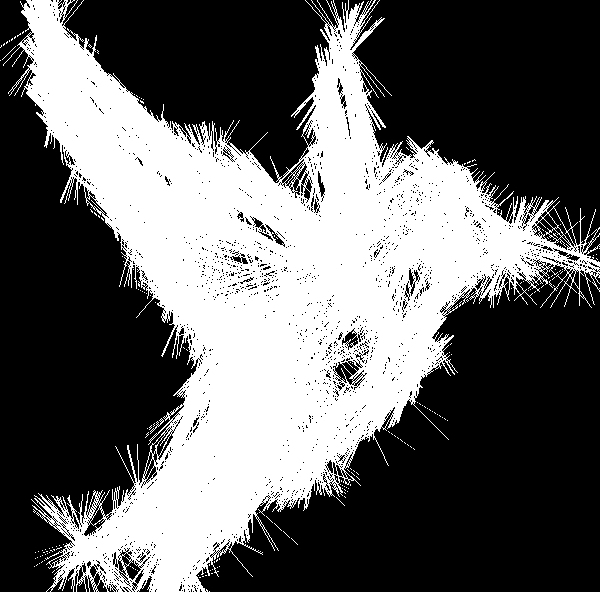
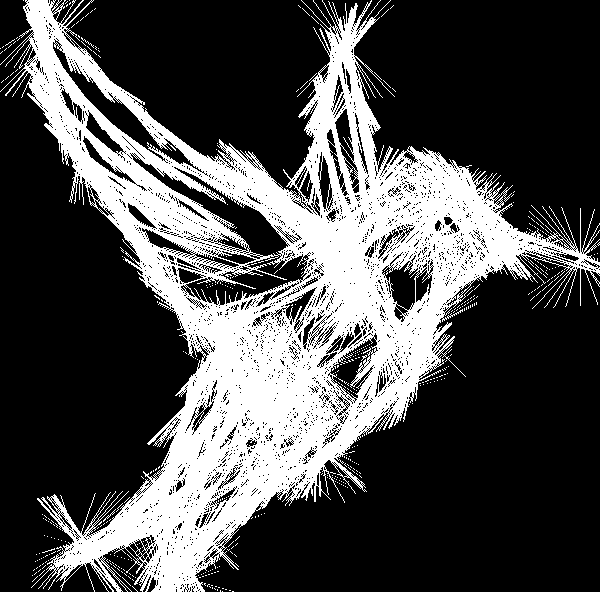
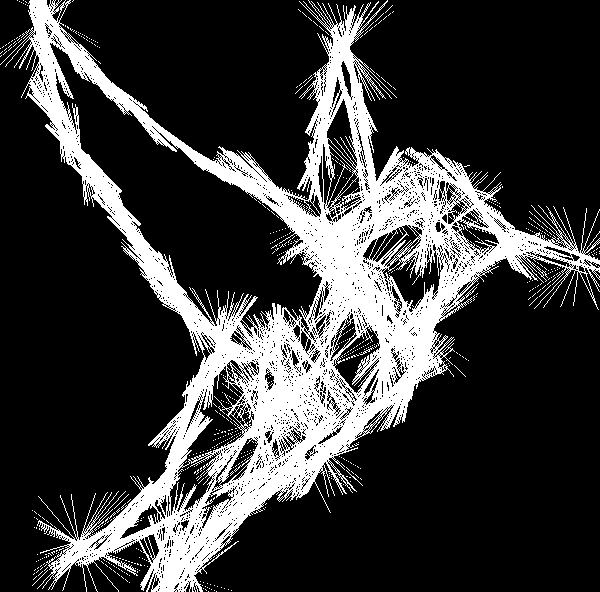
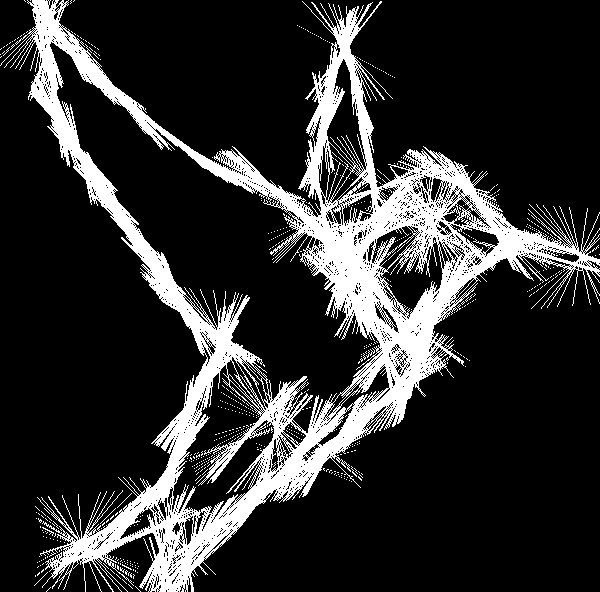
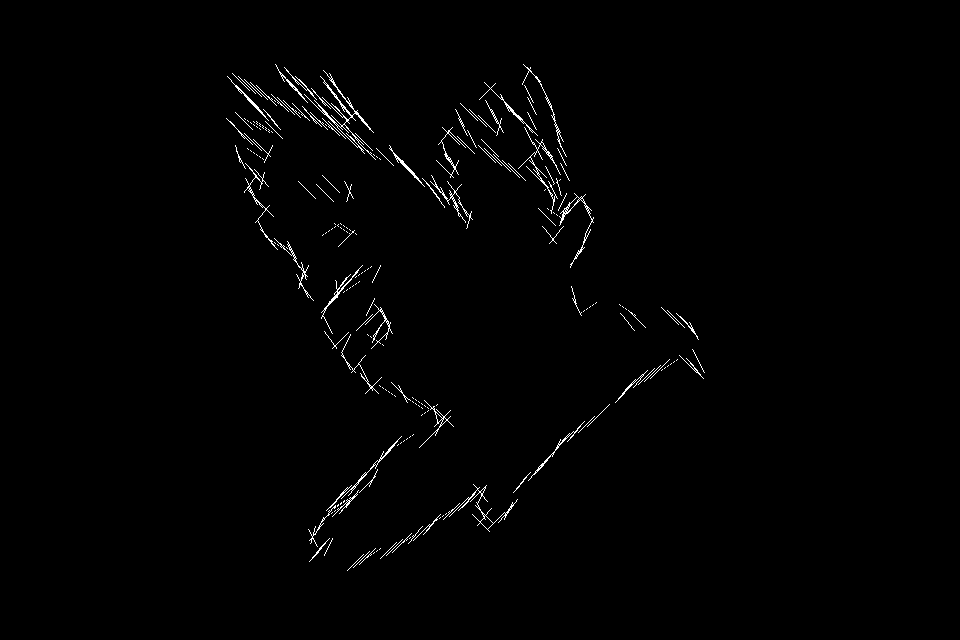
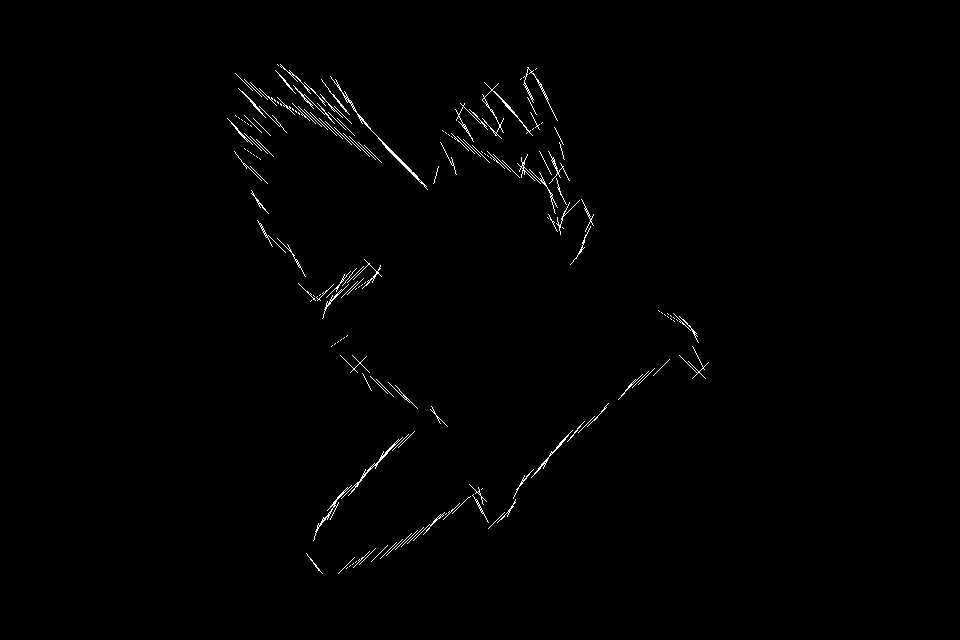
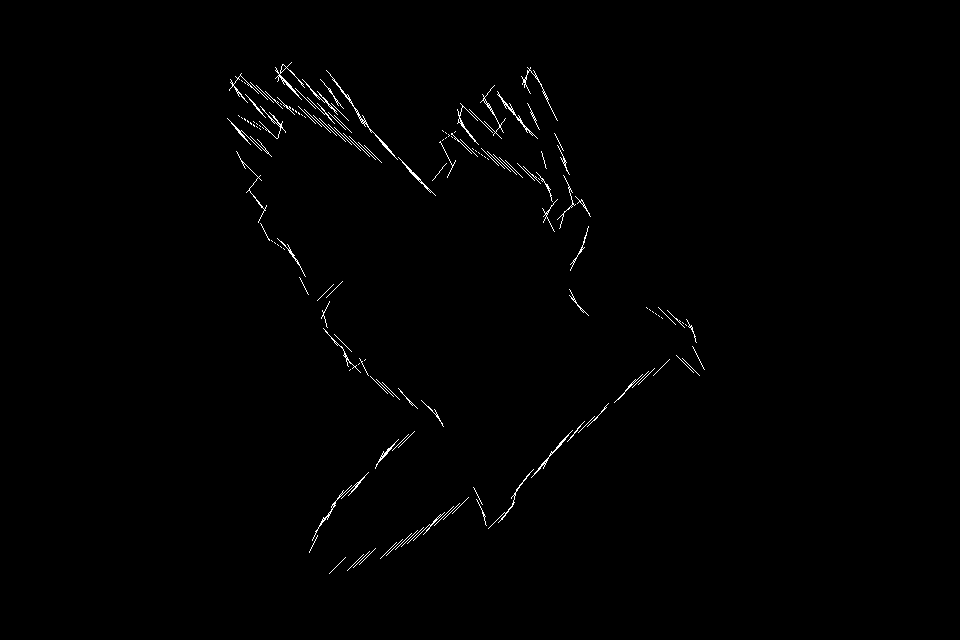
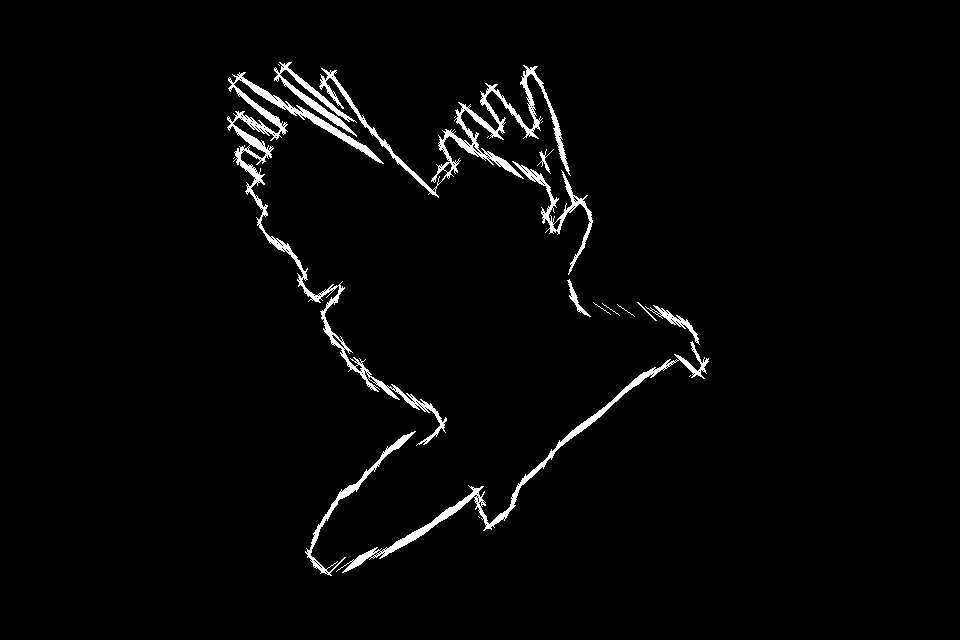
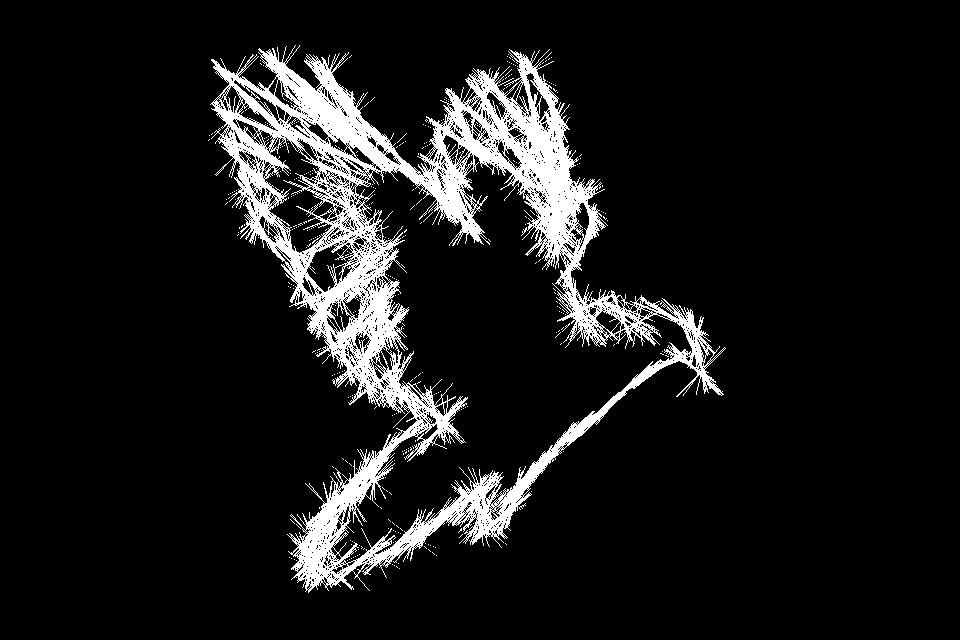
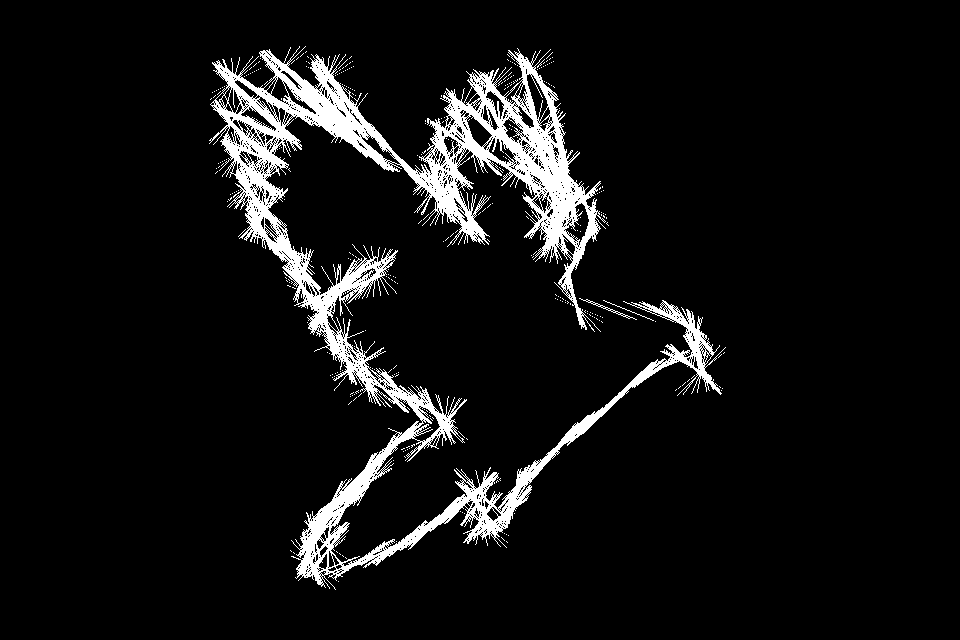
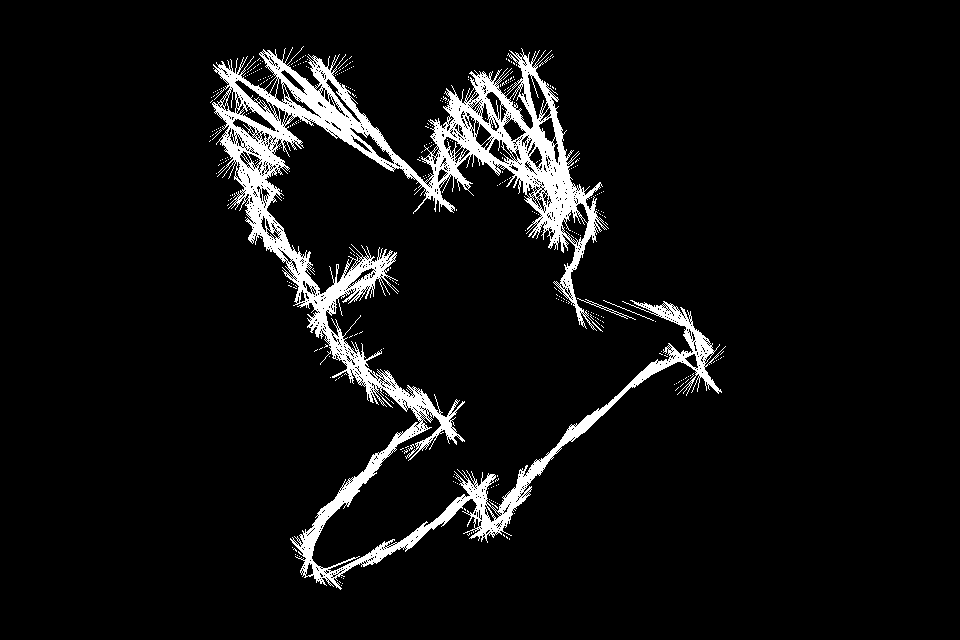
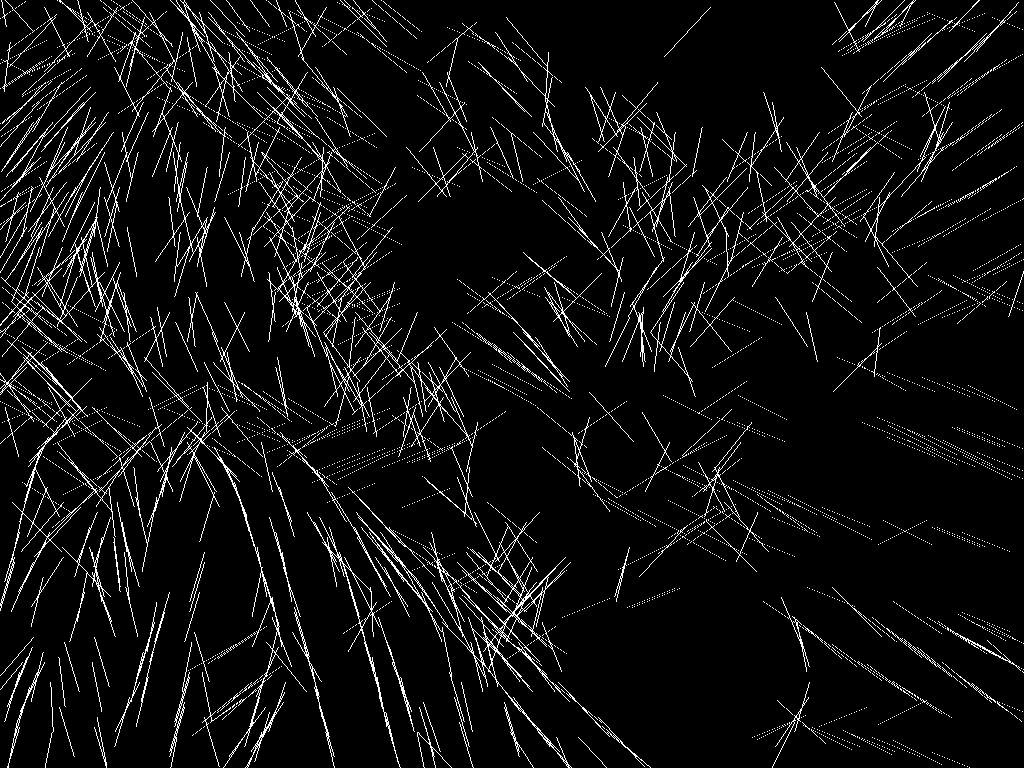
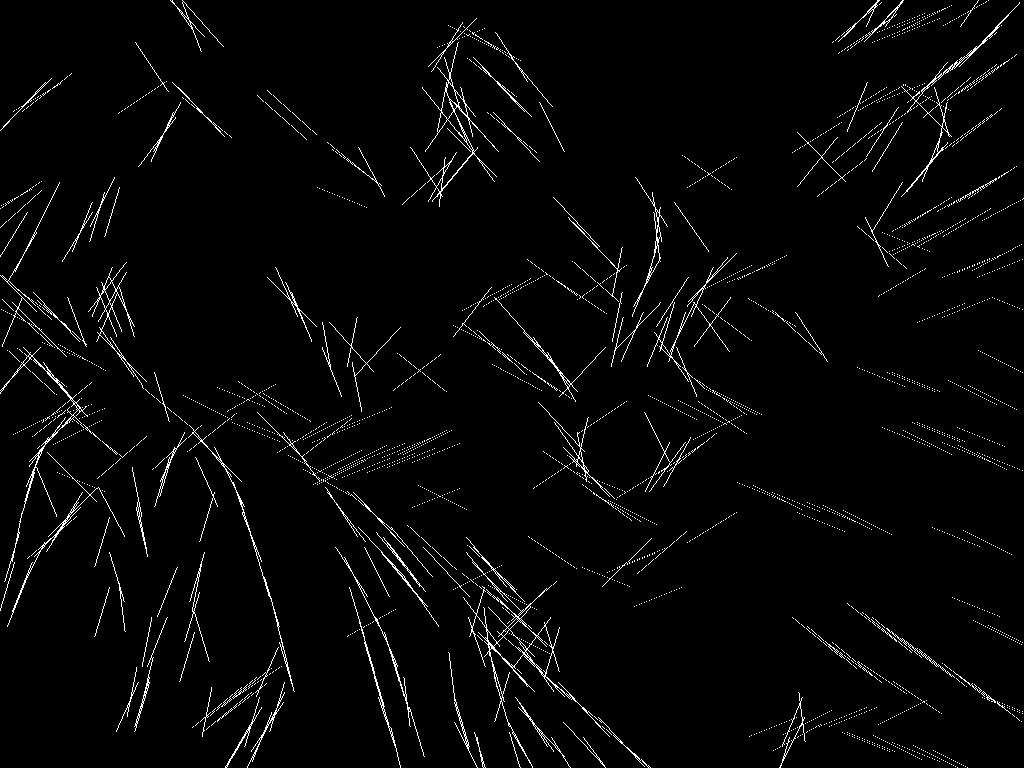
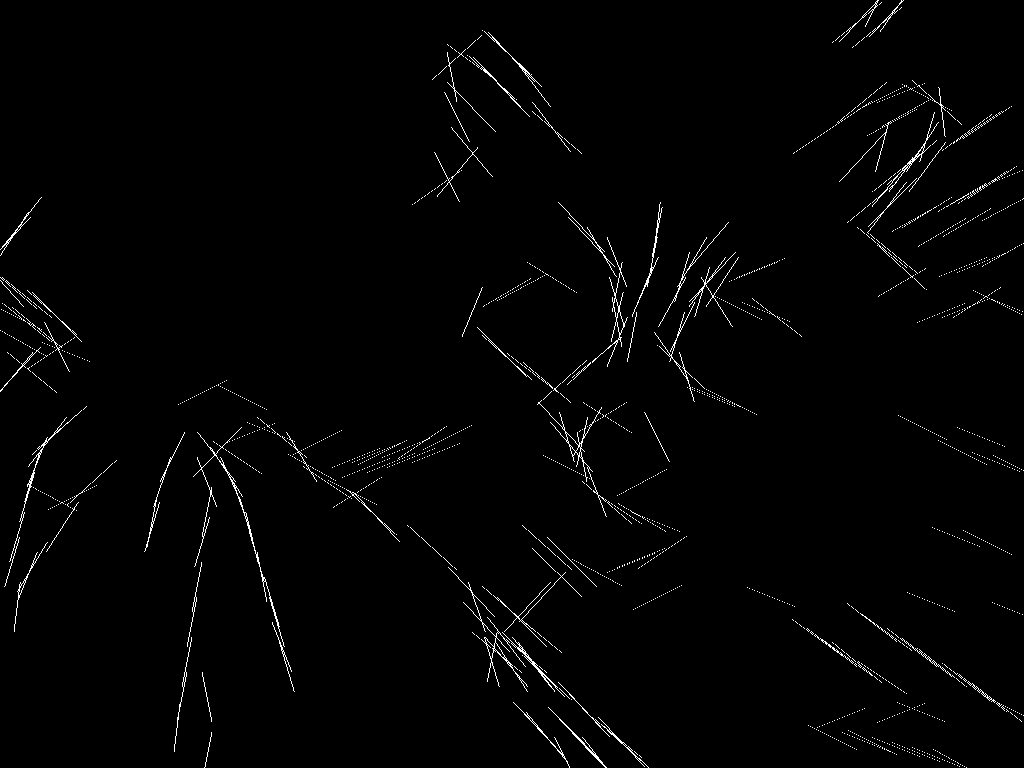
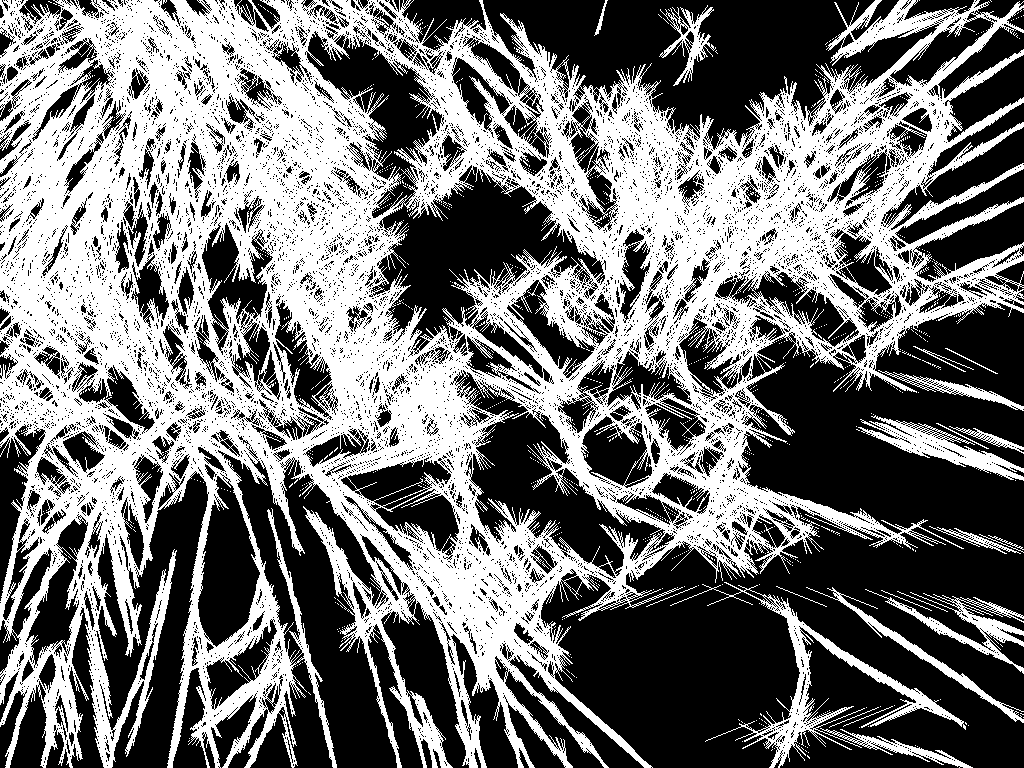
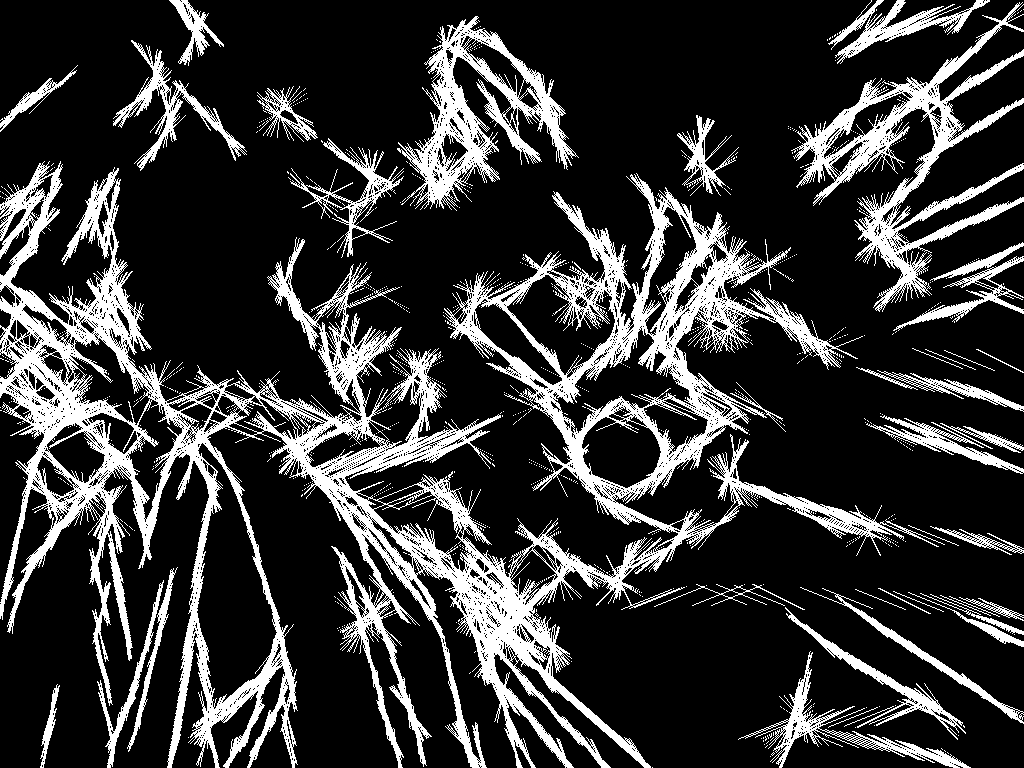
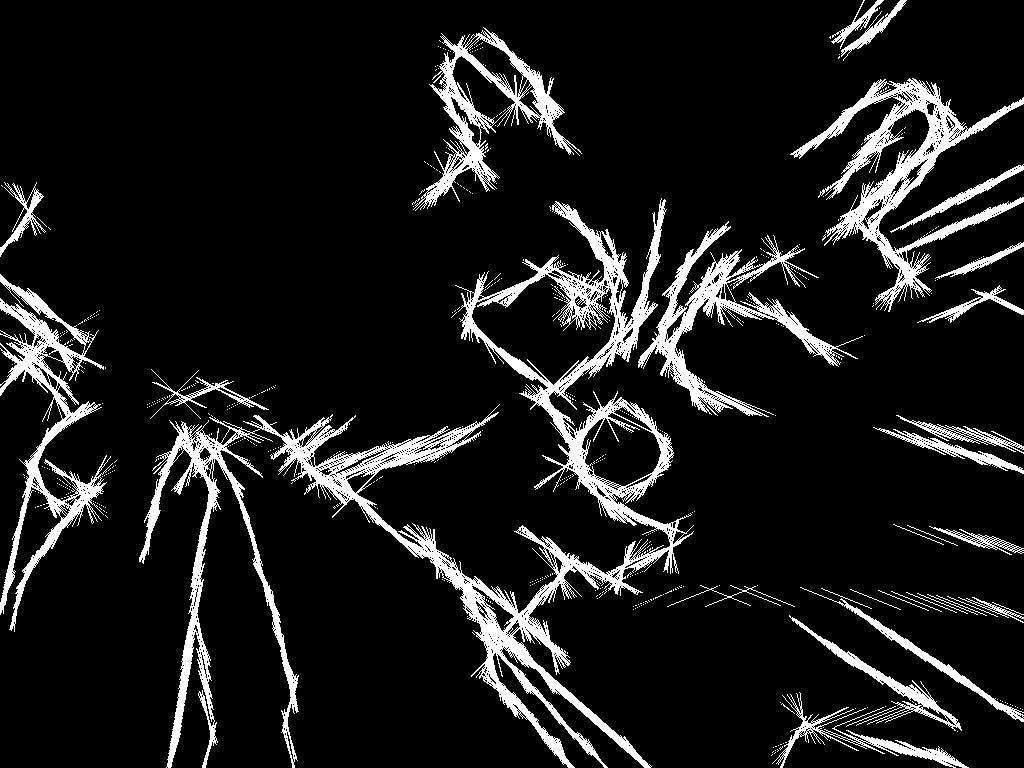
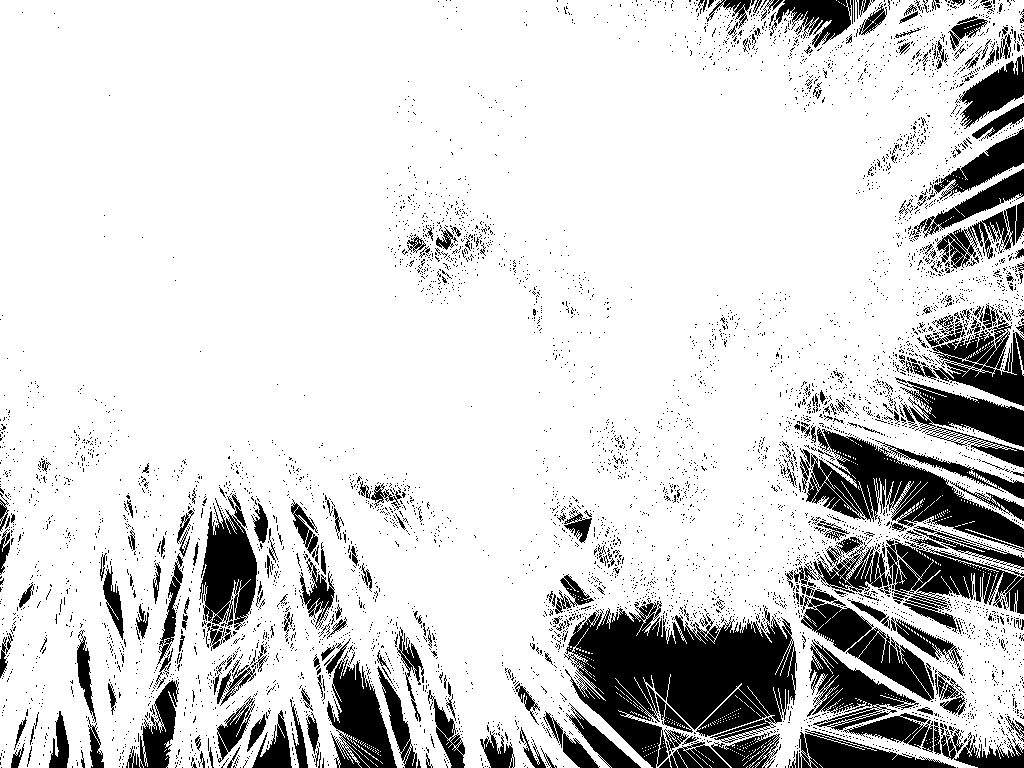
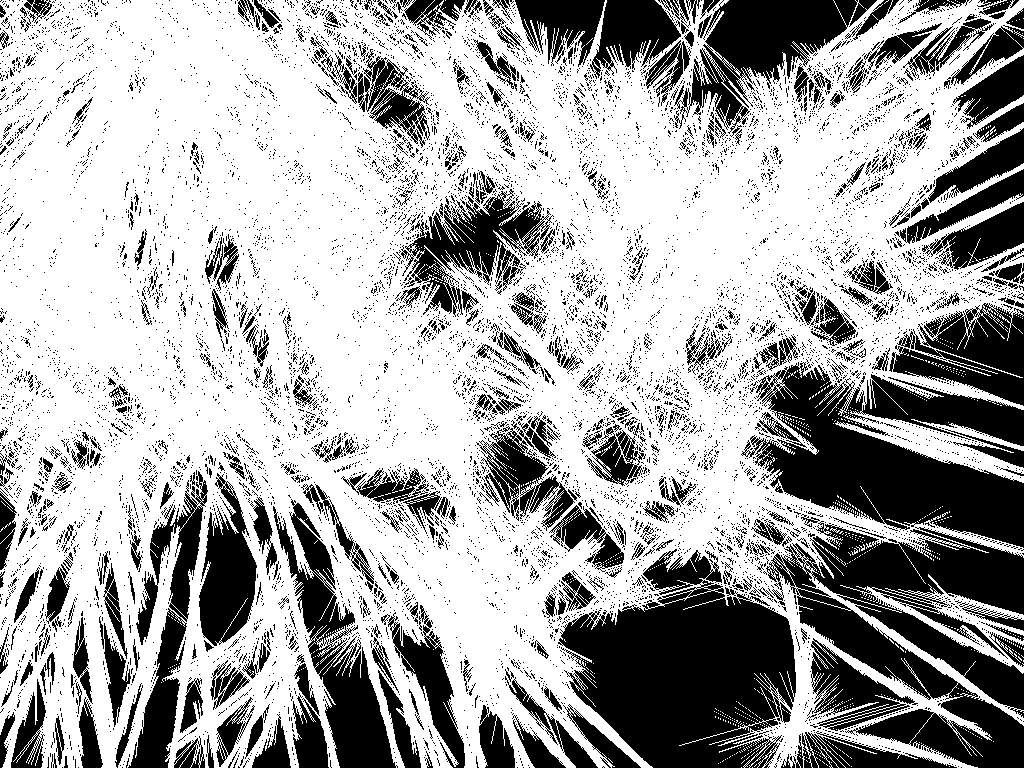
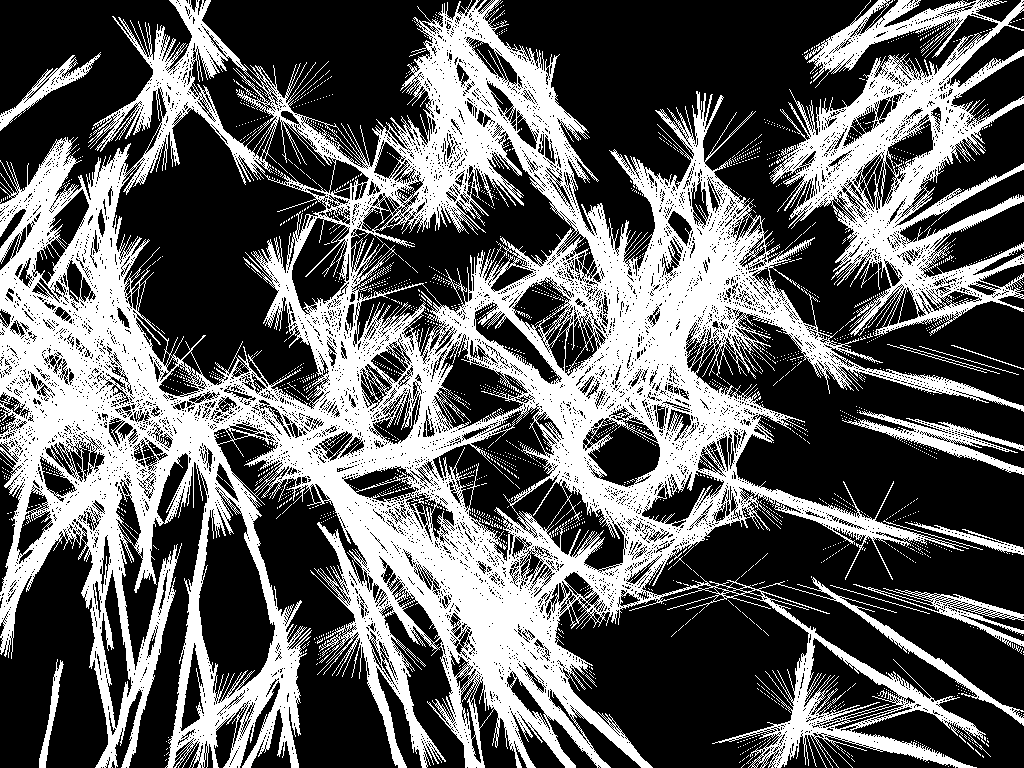
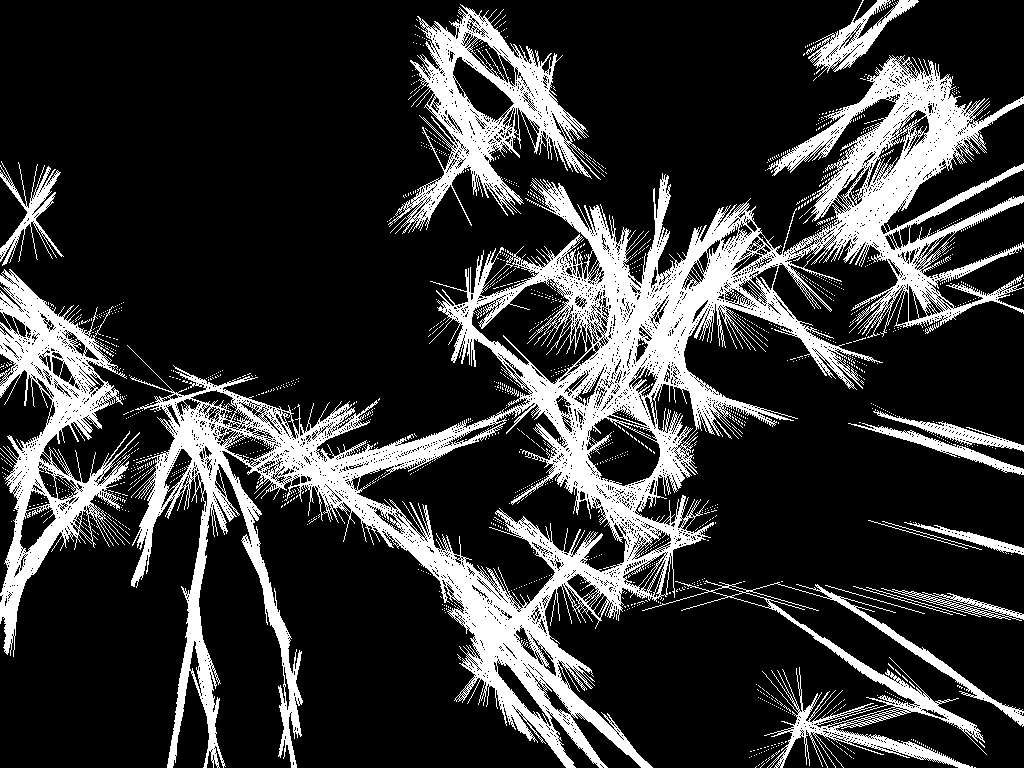
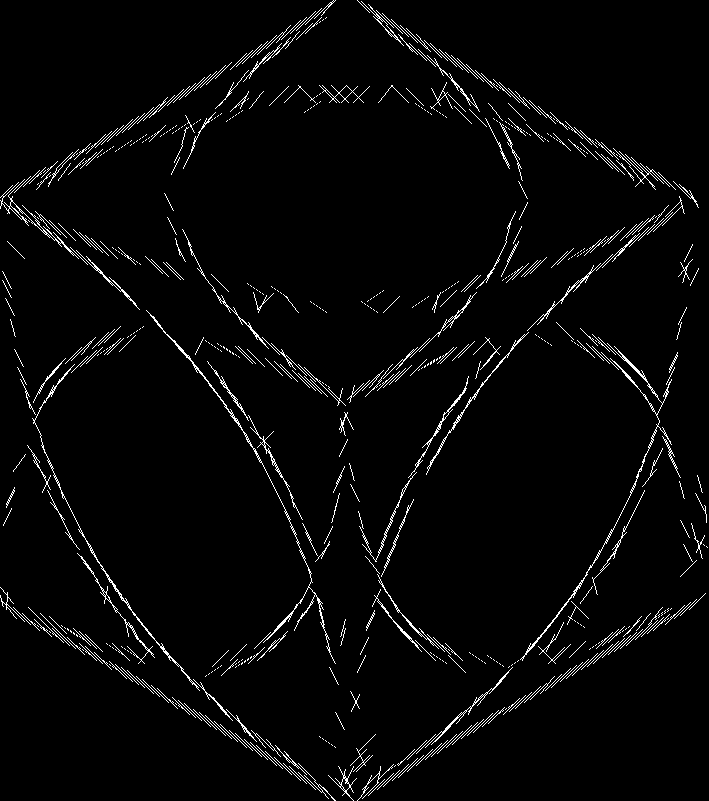
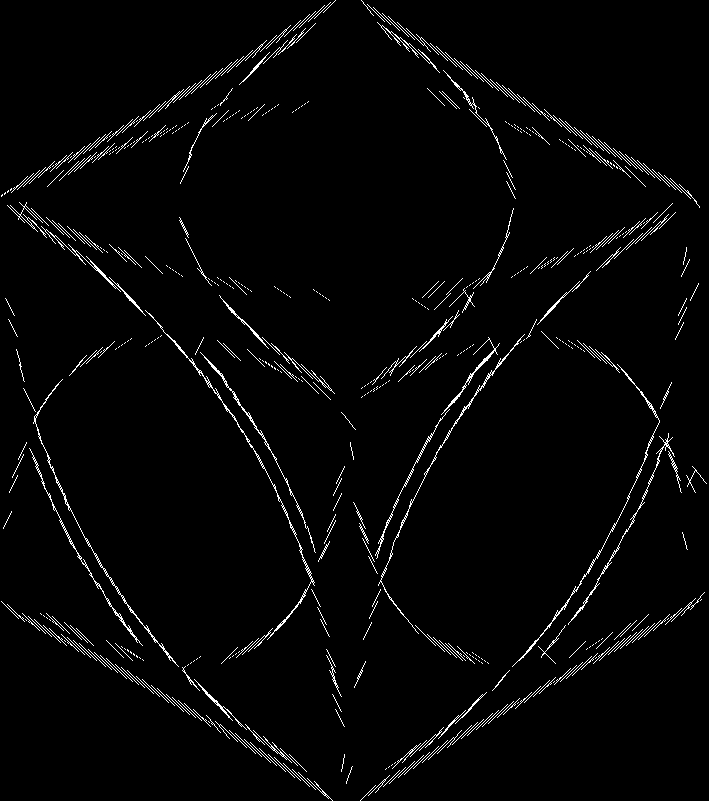
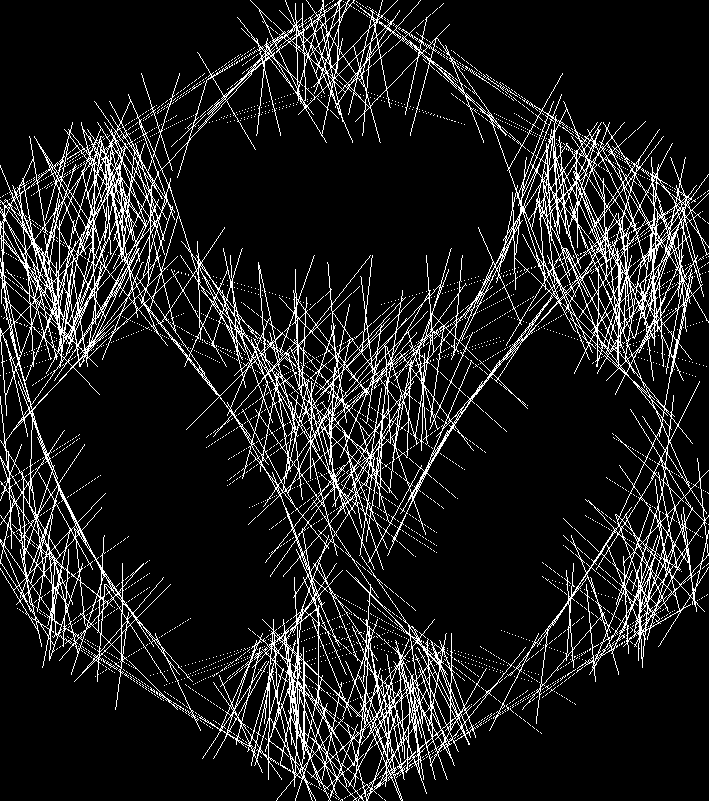
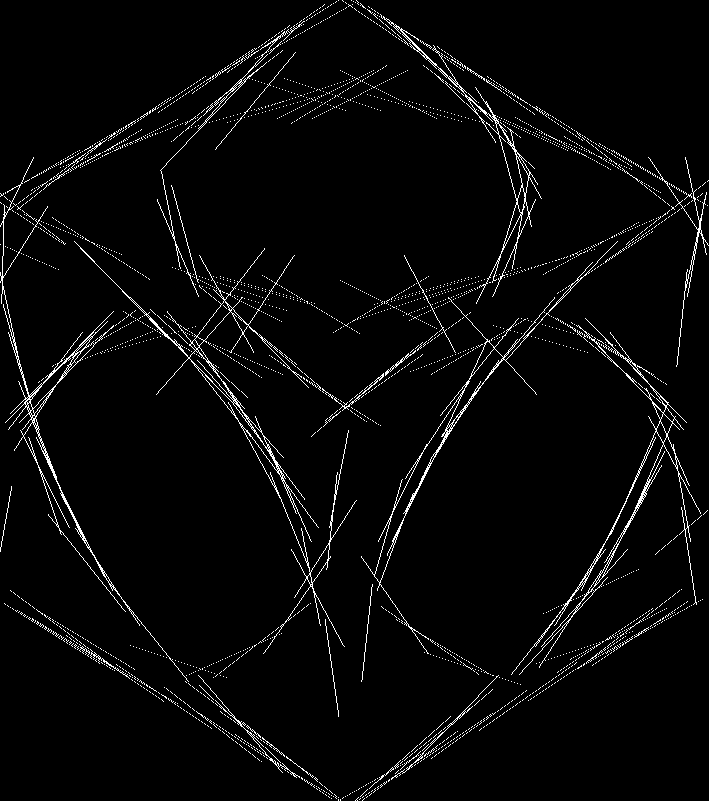
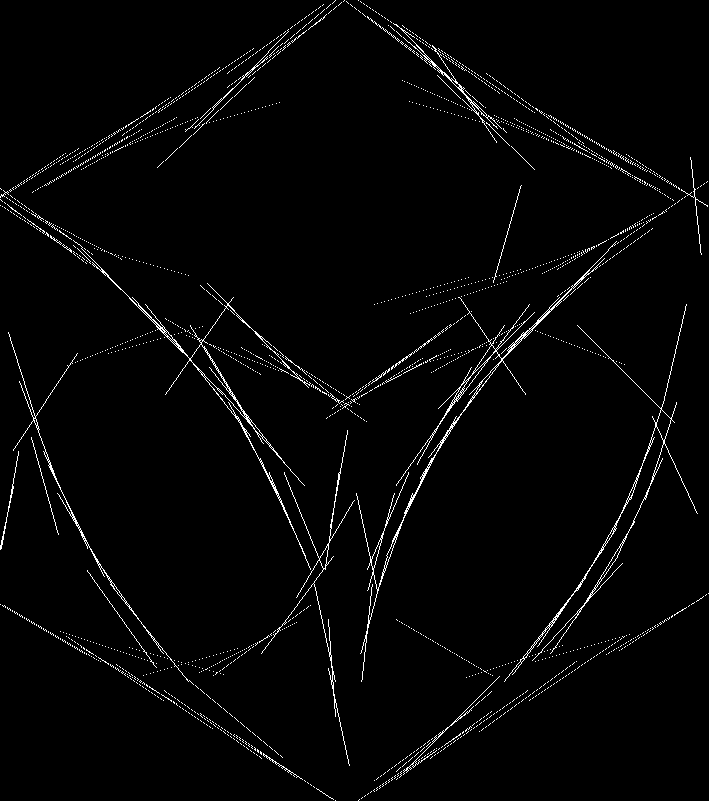
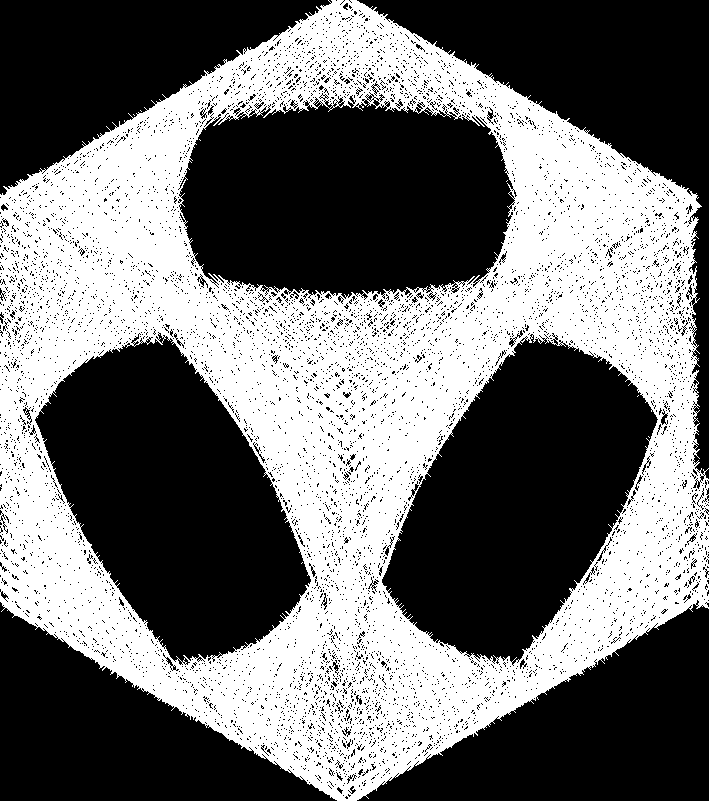
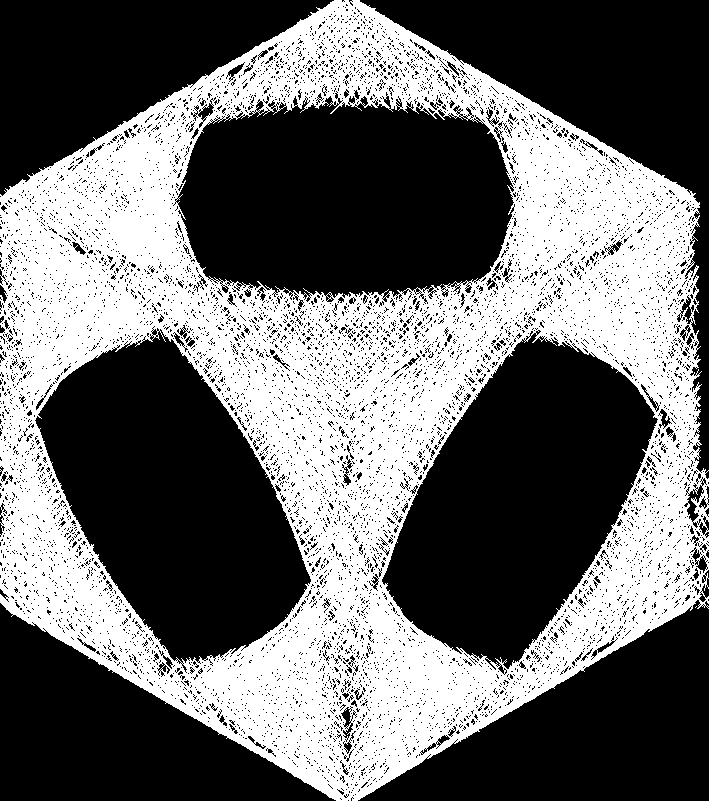
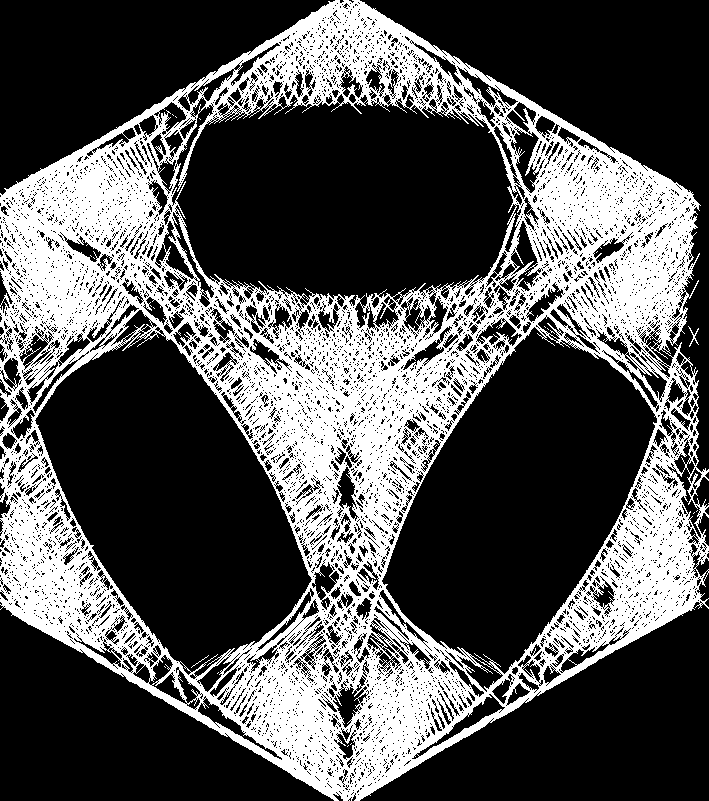
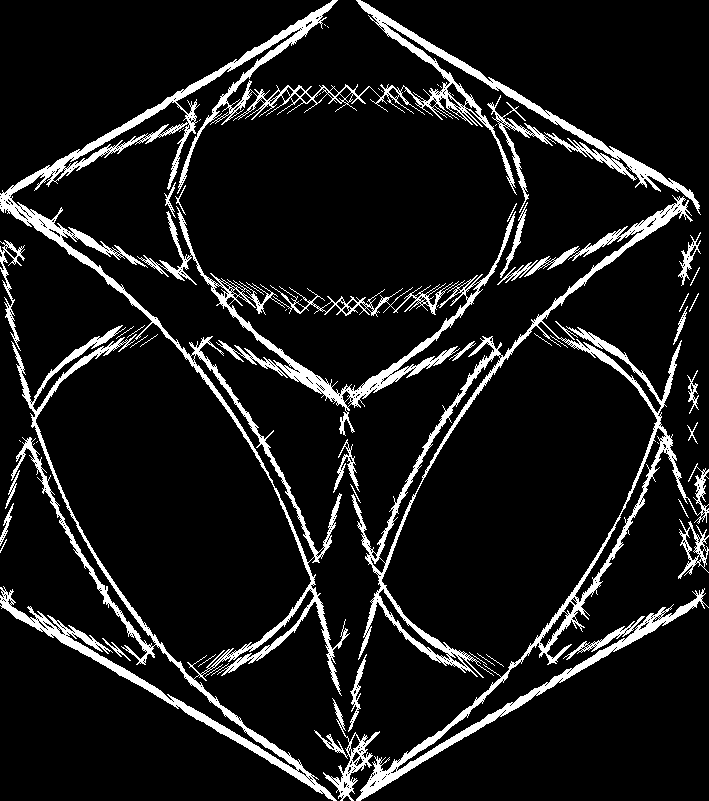
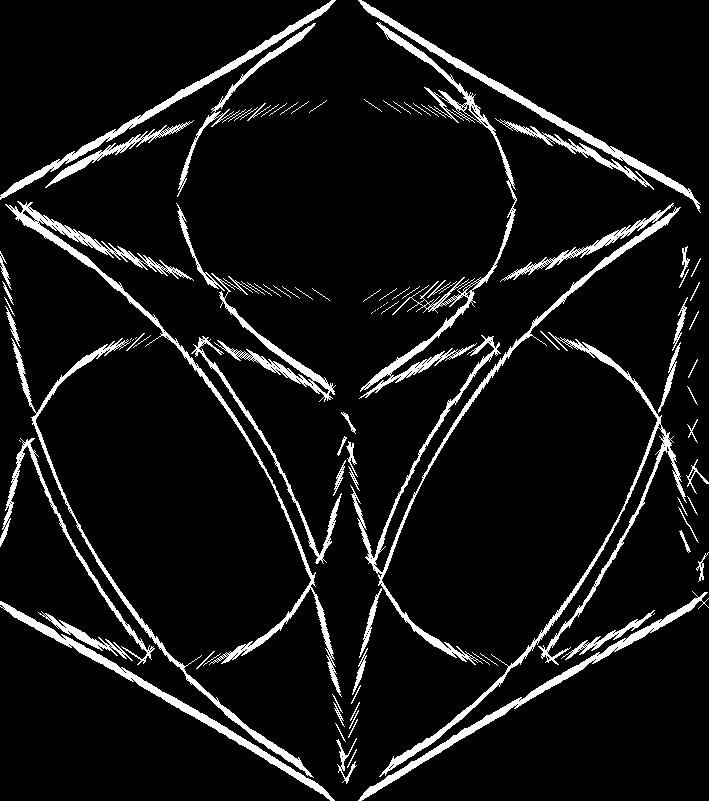
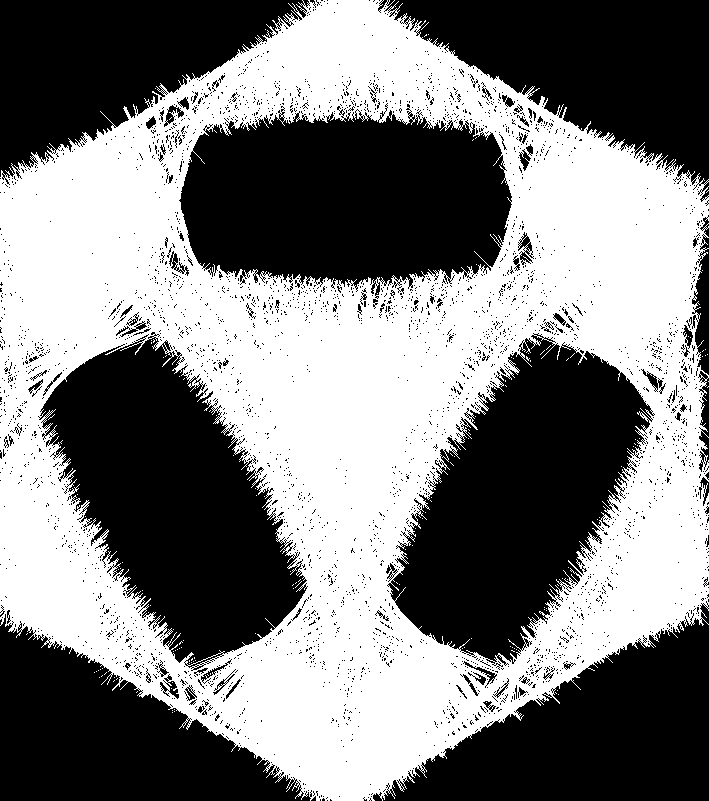
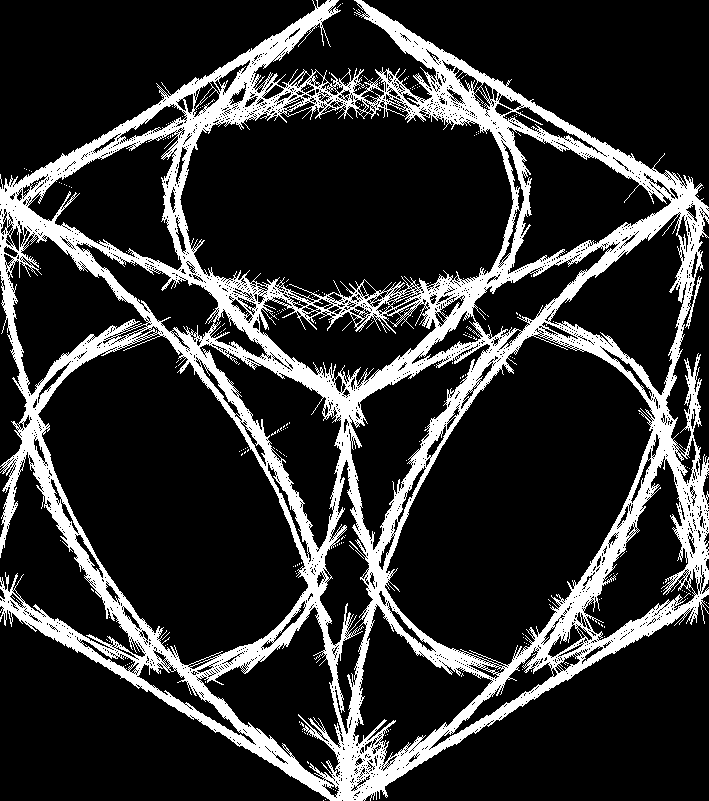
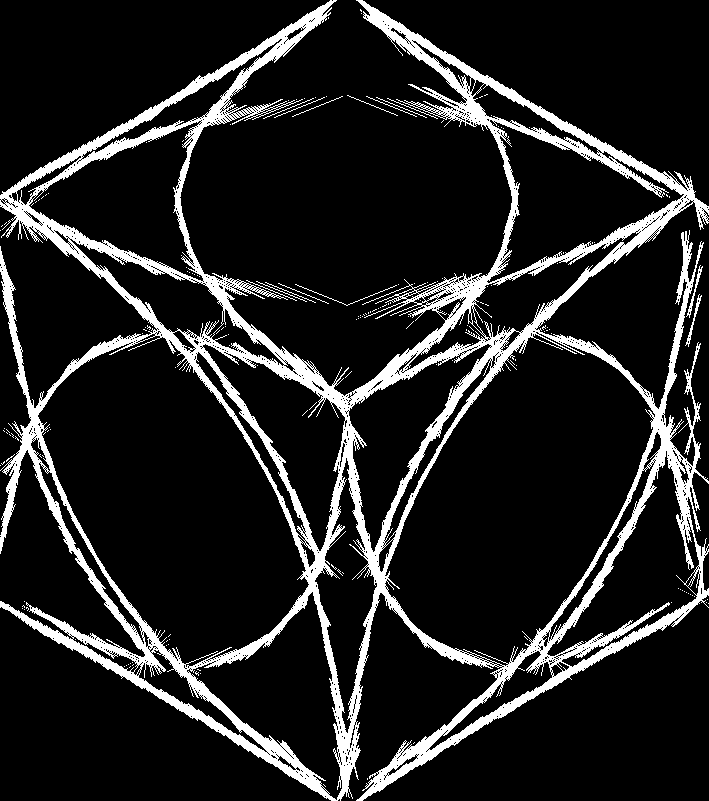
We start by running our input image through a Canny filter so we can detect a wide variety of edges. We can modify the threshold (sigma) of this filter to preserve varying levels of detail in our final output image. In this project, we will use sigma values from 1 to 5. Examples are further down this page.
We can break any of these edge map images im up into a series of NxN pixel squares, which we will call image segments. In this project, we use numpy for this as follows:
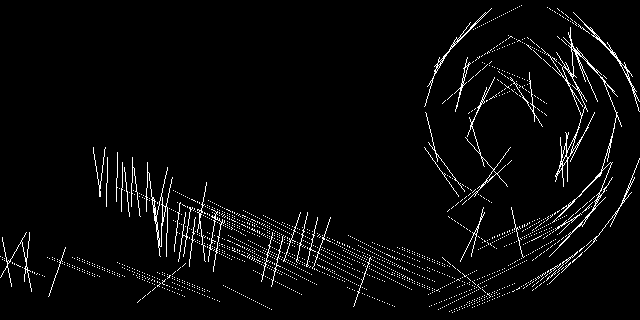
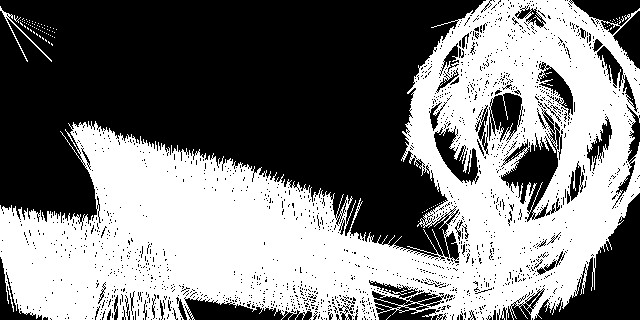
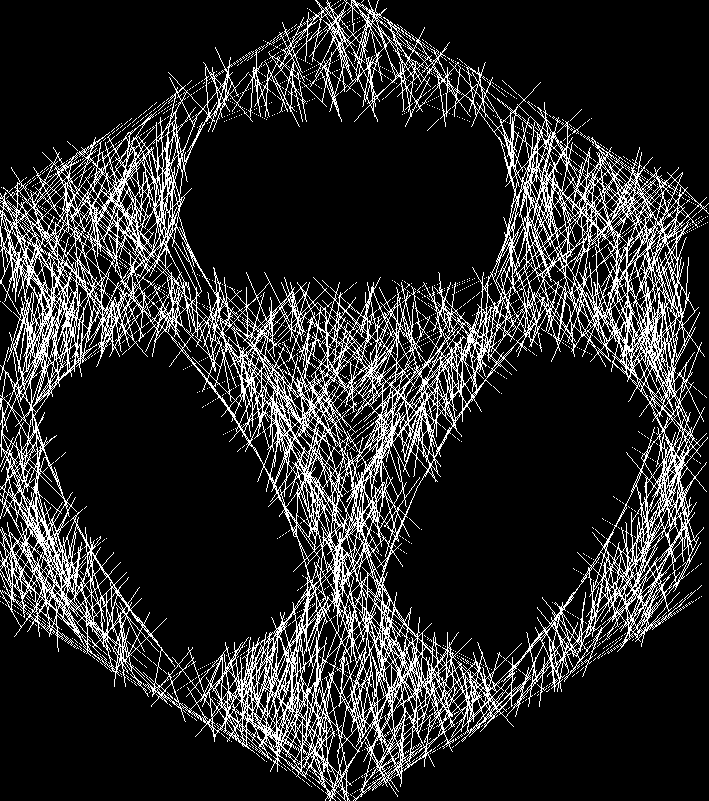
for i in range(im.shape[0]-N):The make_sparse flag on line 3 controls whether we want the filter's output to have attempted line generation for every possible NxN square, or if we only want to check a grid of squares. The impact of this choice is shown in further detail below.
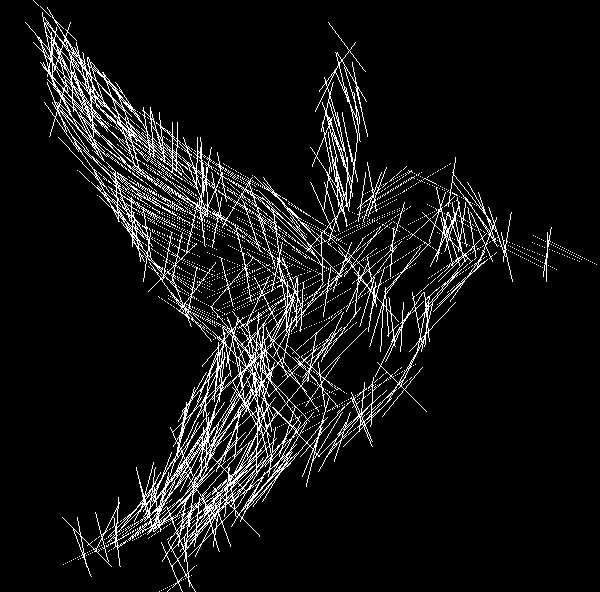
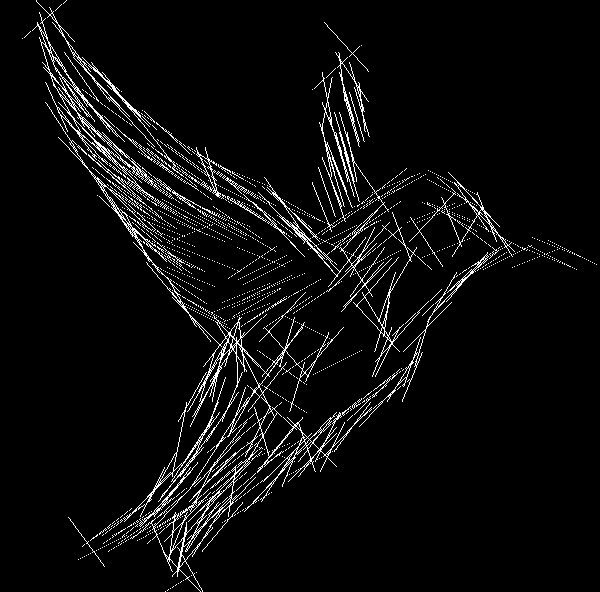
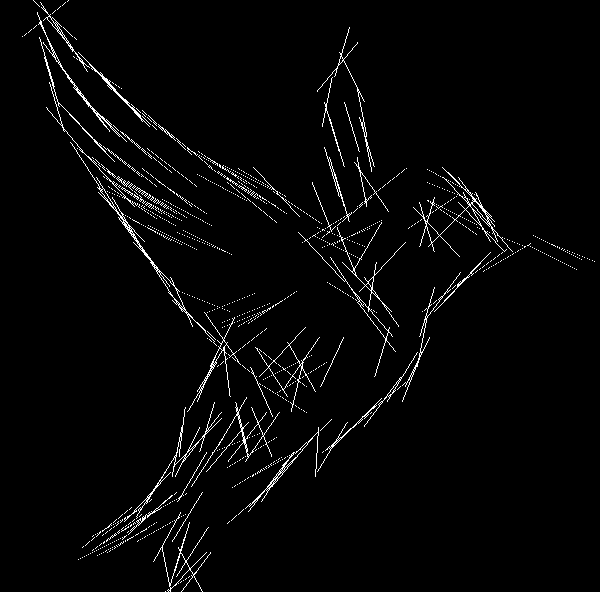
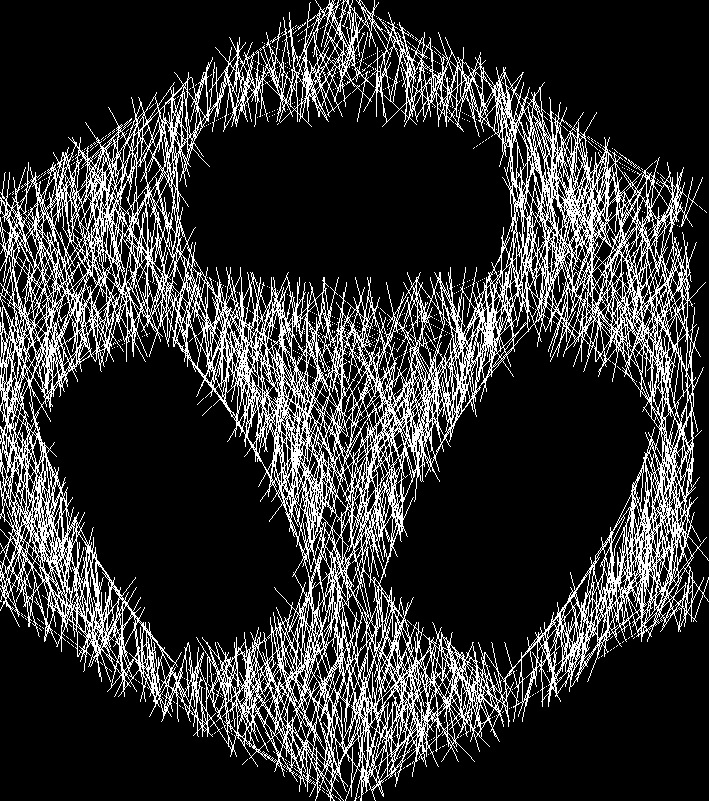
For each of these image segments, we attempt to find a line that properly represents its content. That entails the following 2 things:
Finally, we draw our line on the canvas that will eventually be our output image. As mentioned above, we draw a line with the calculated slope through the center of the image segment. The length of the line is given by (roughly) N^2.
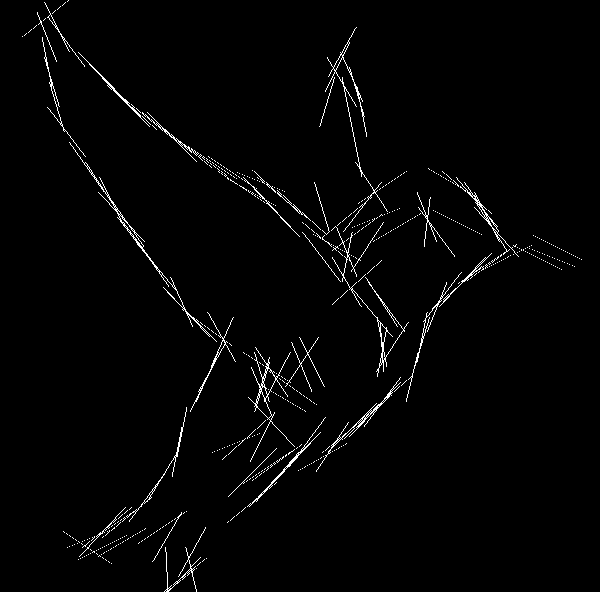
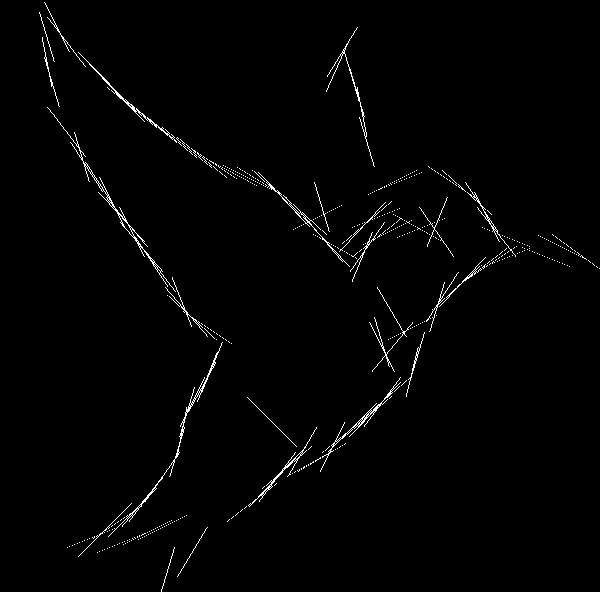
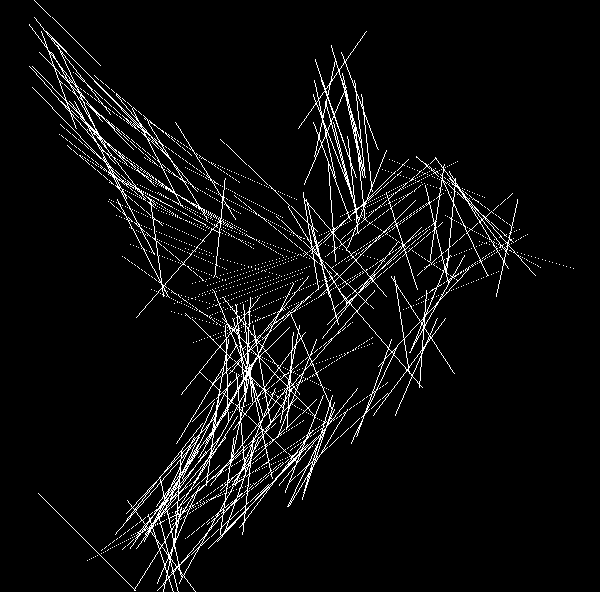
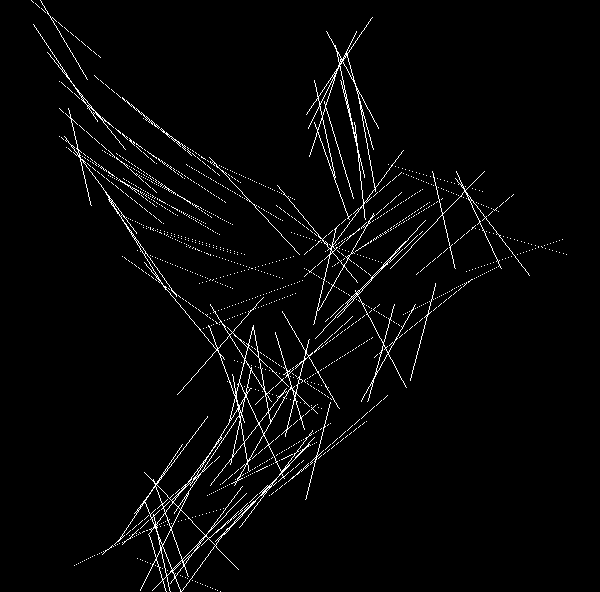
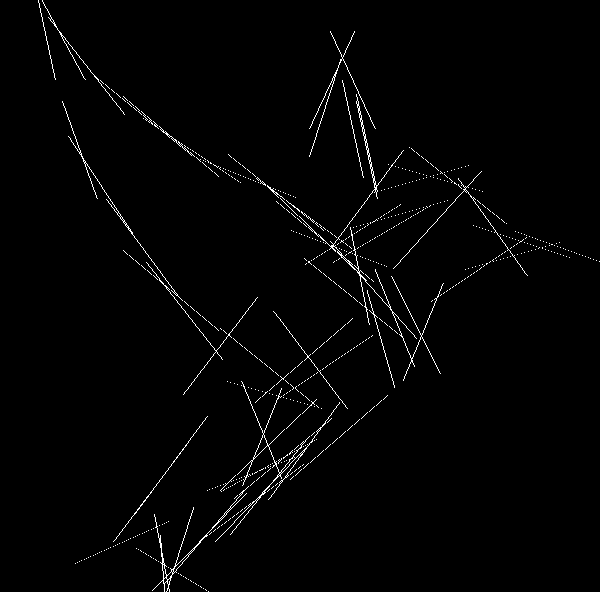
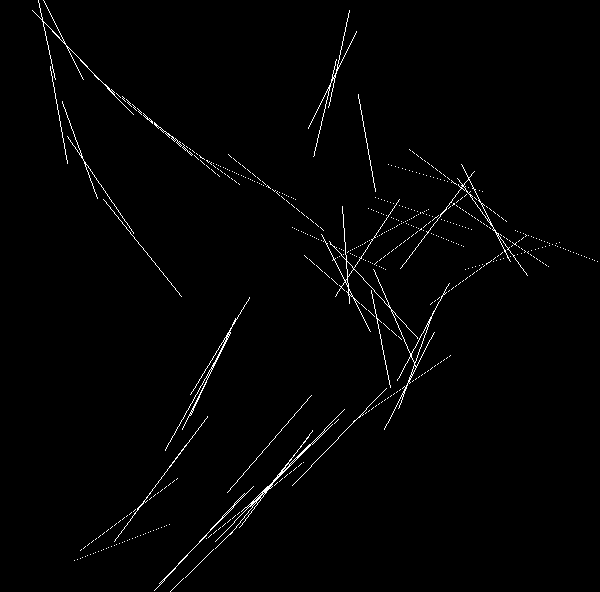
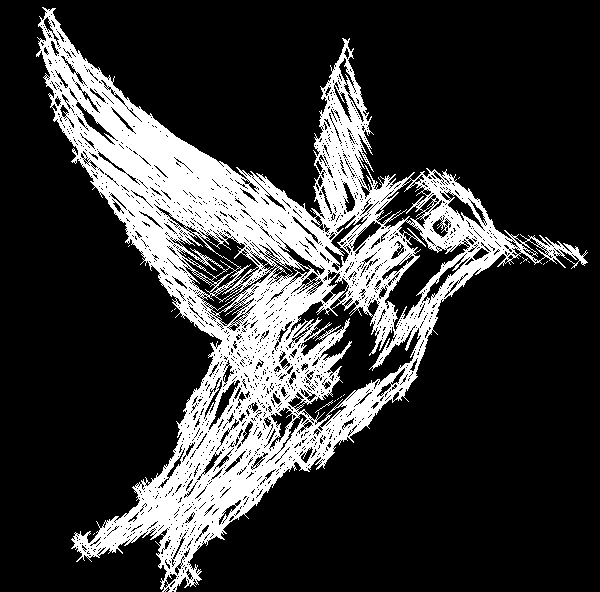
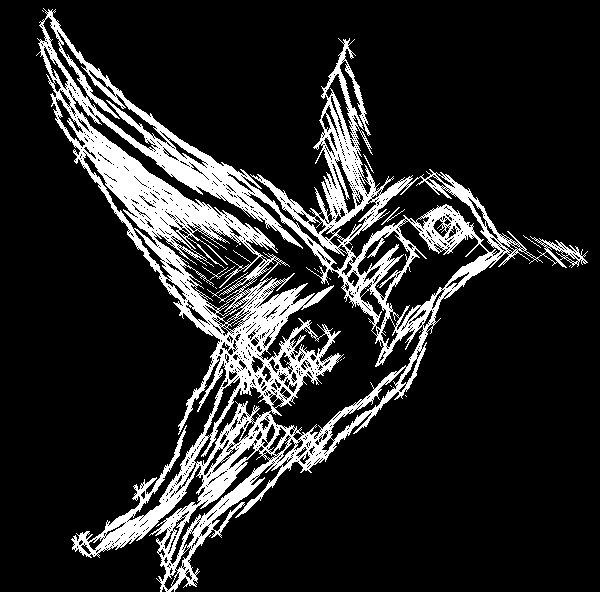
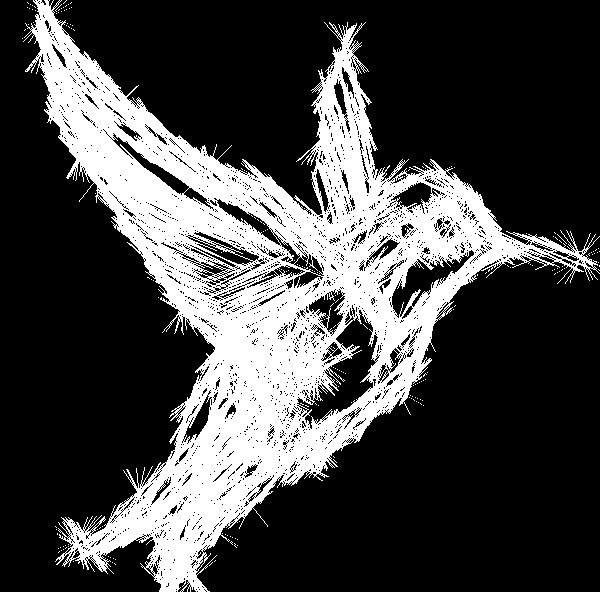
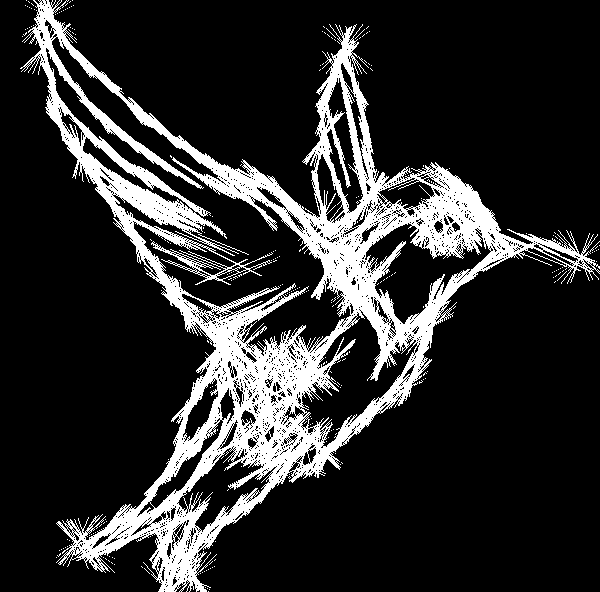
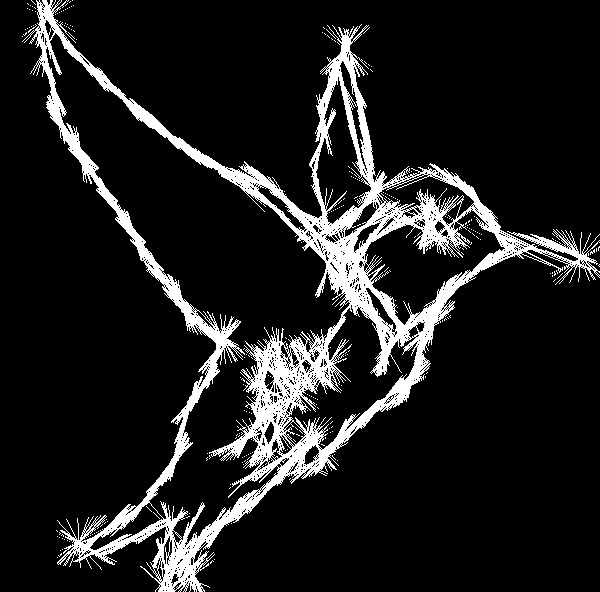
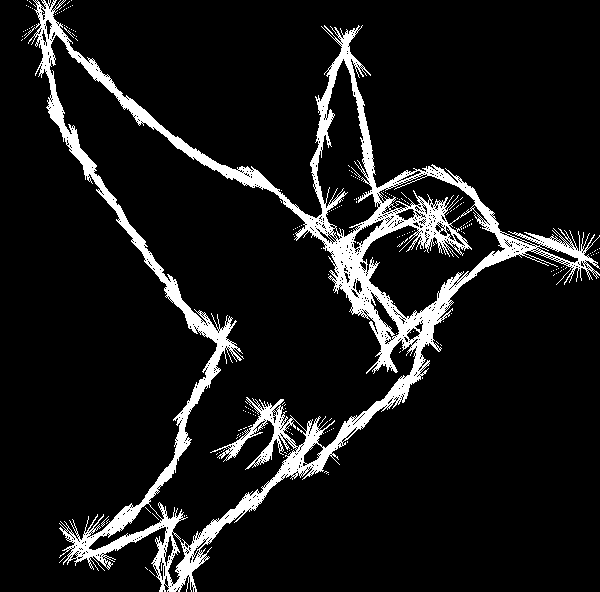
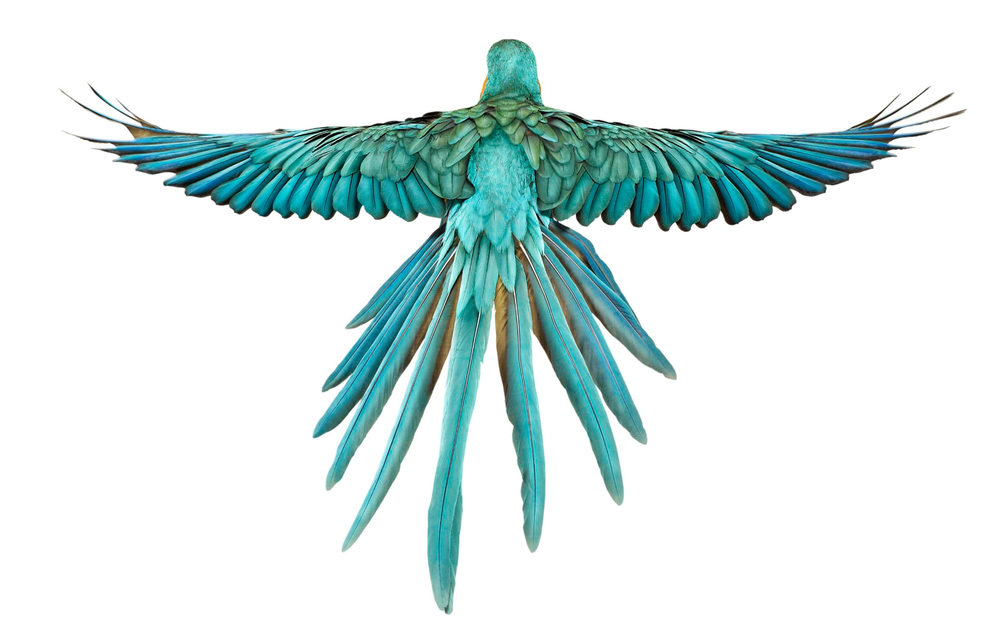
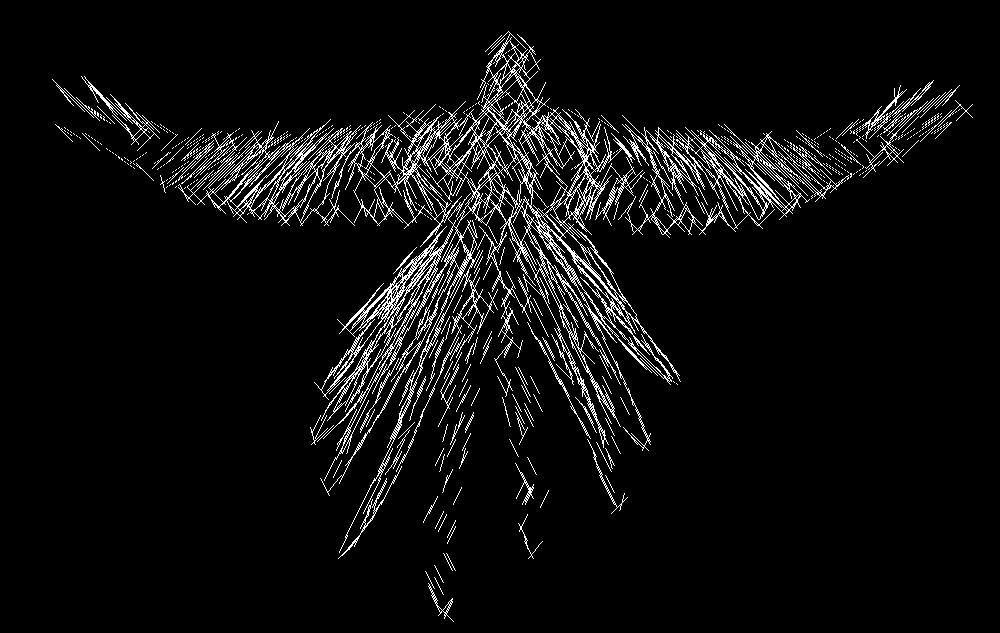
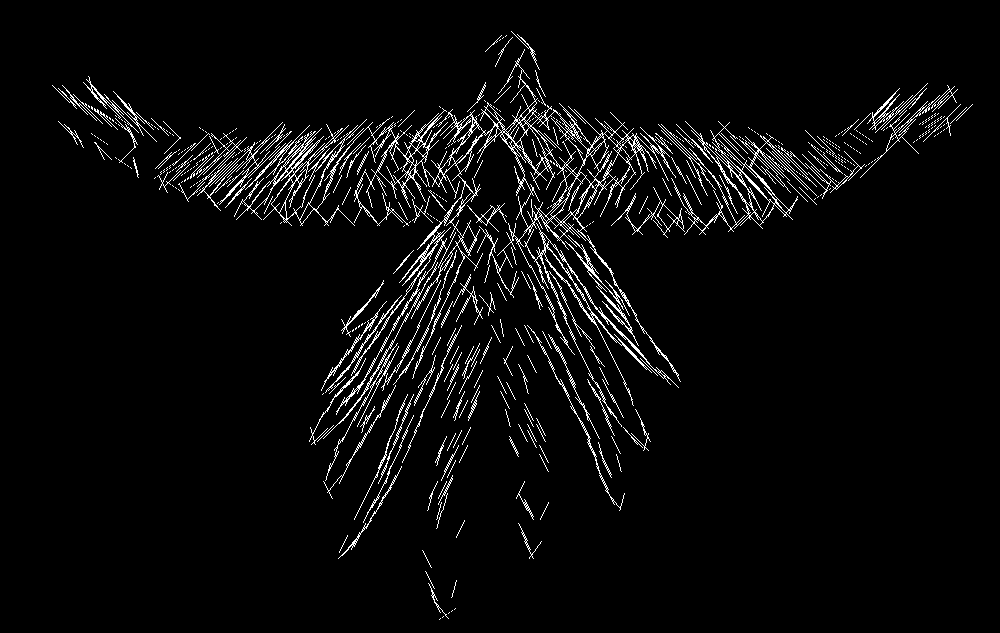
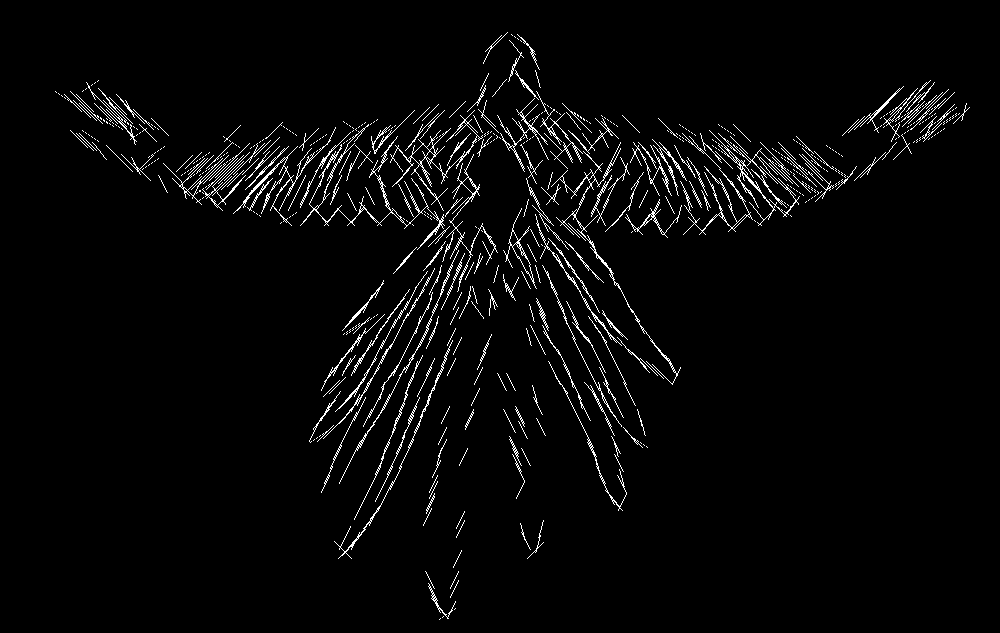
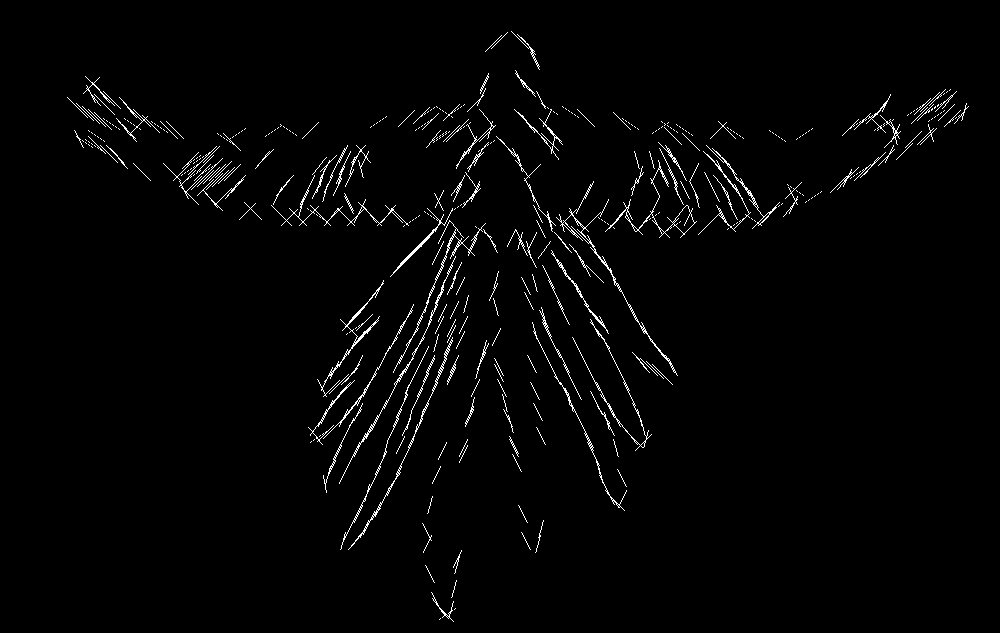
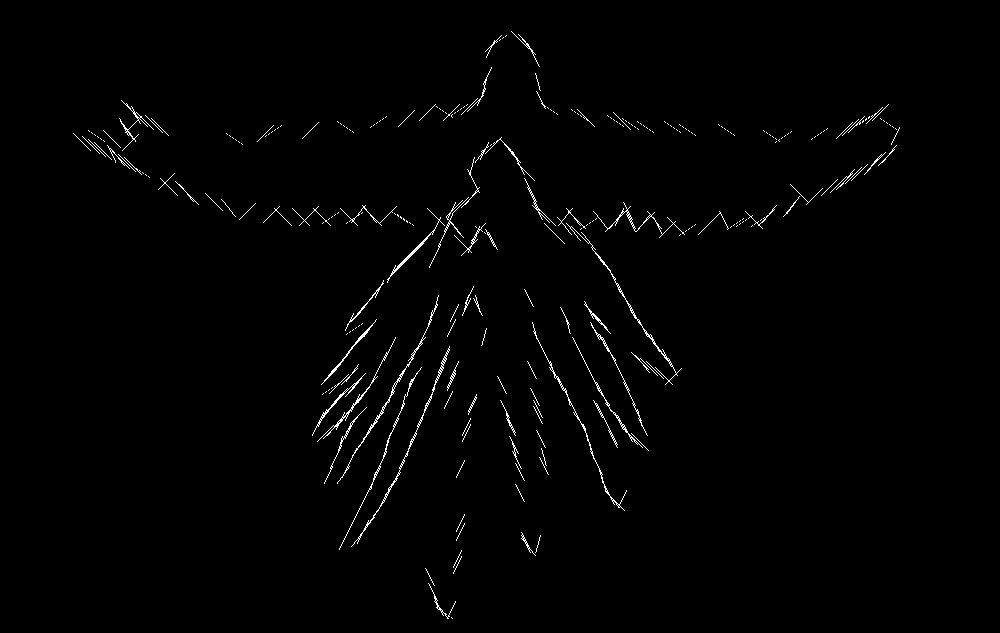
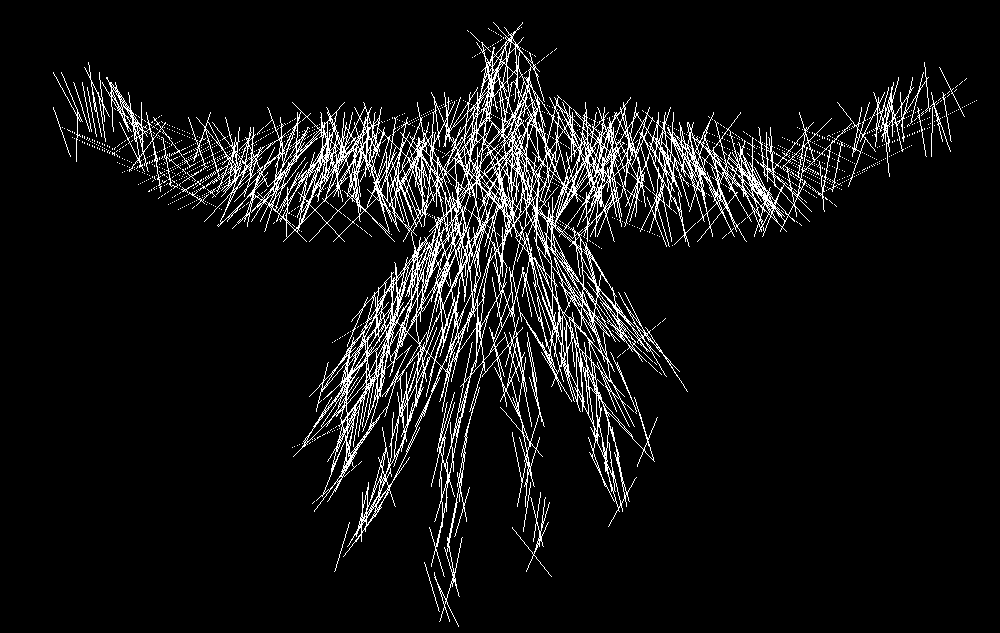
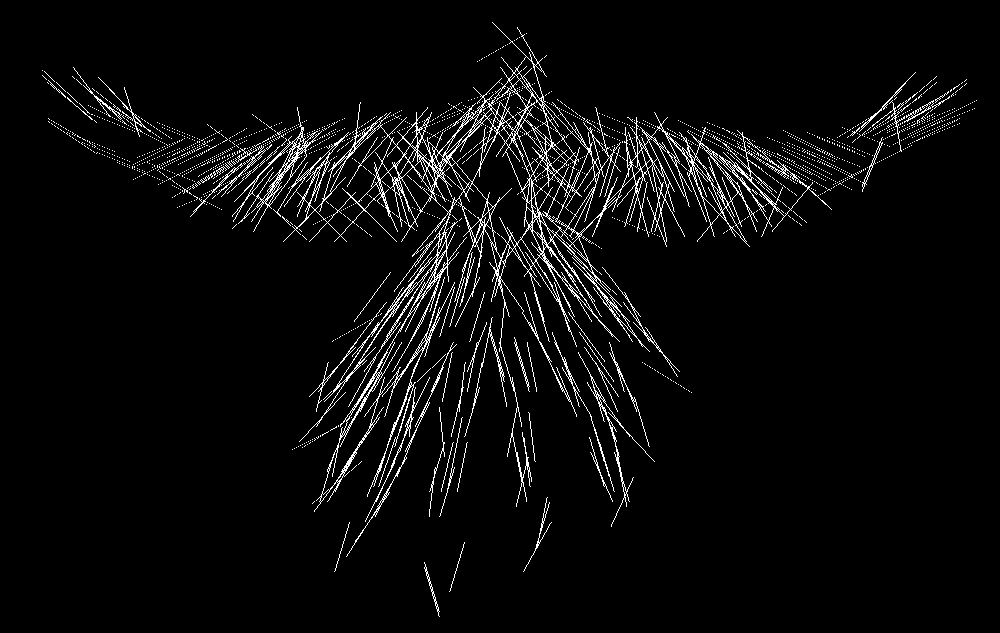
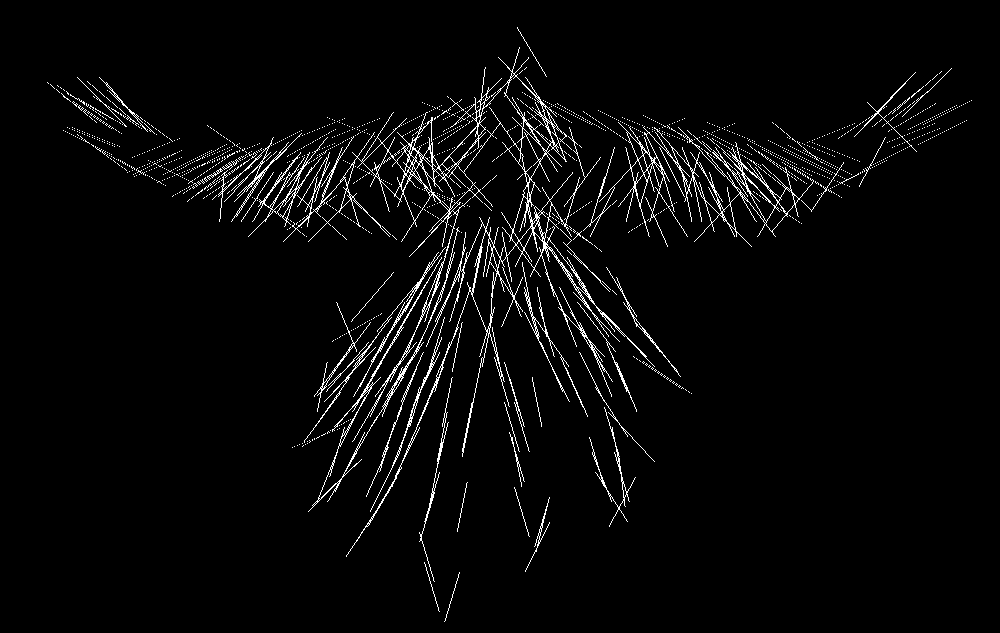
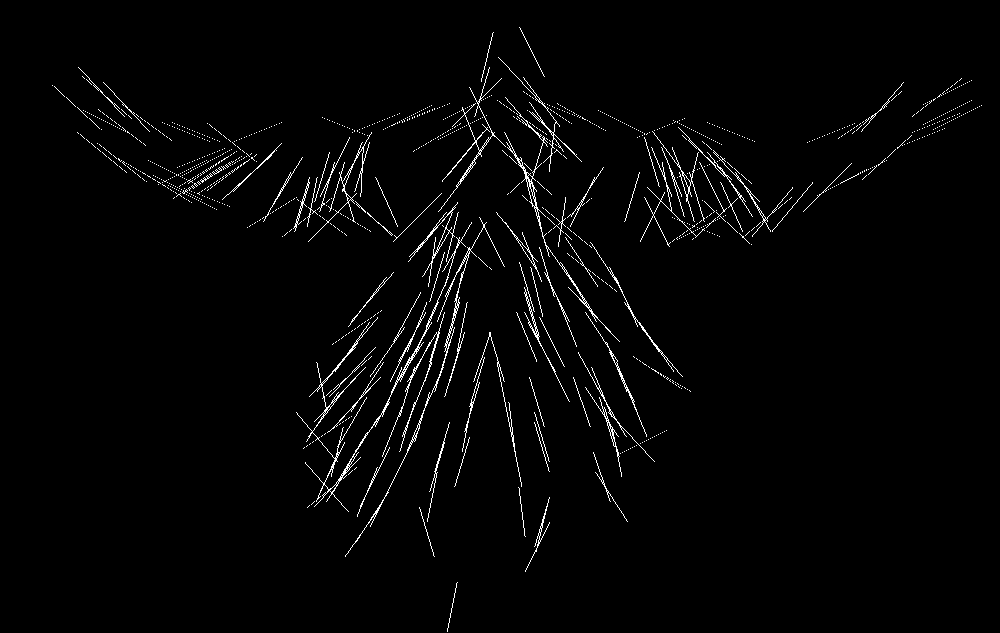
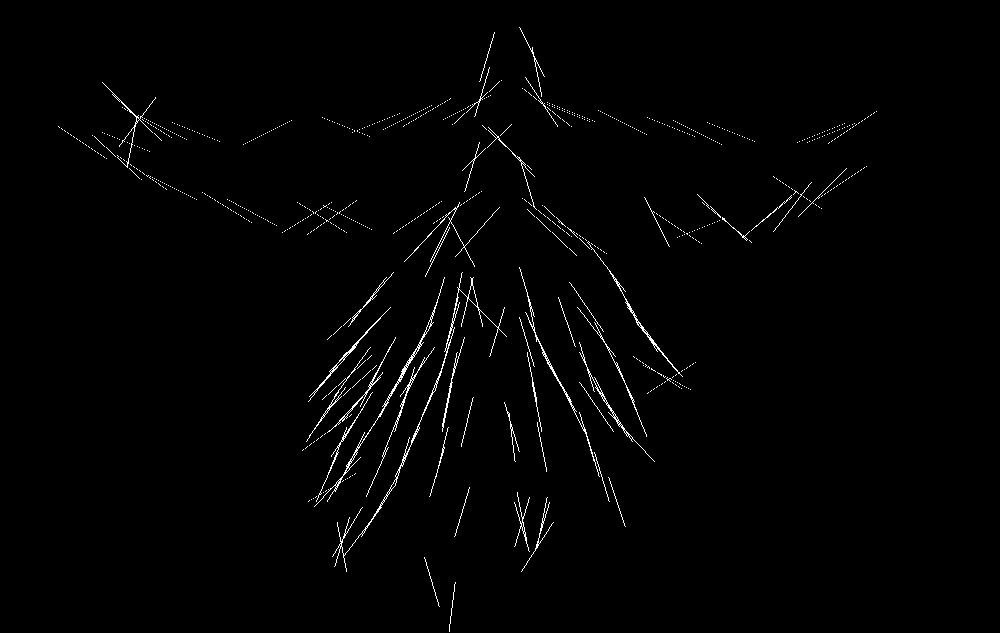
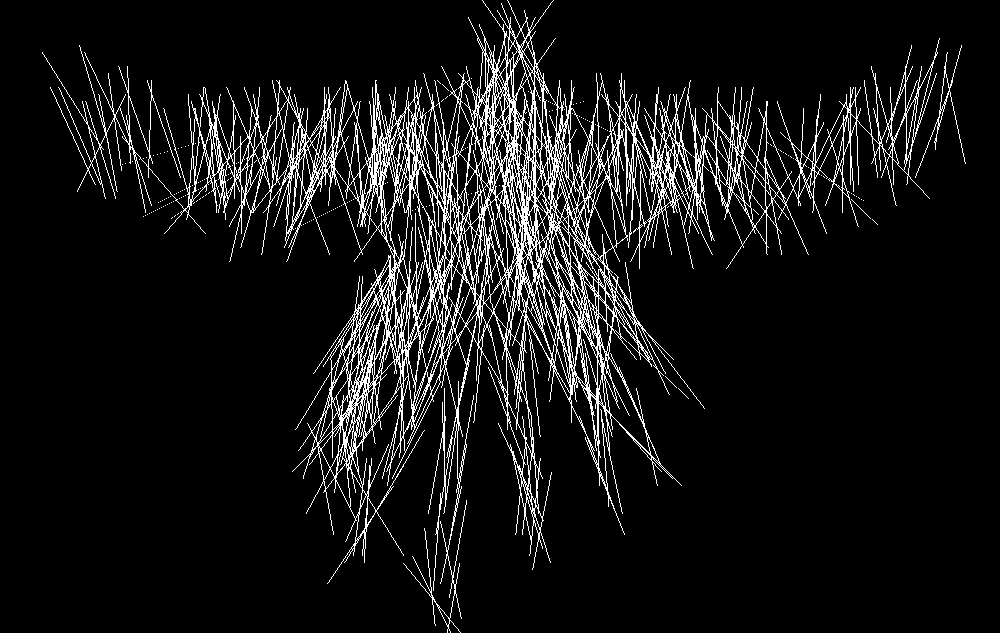
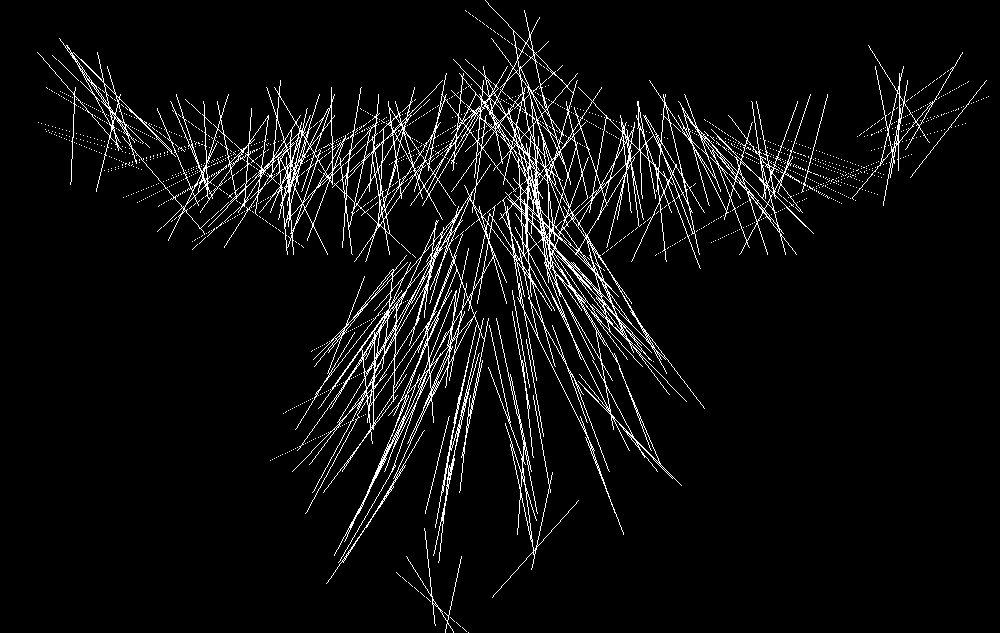
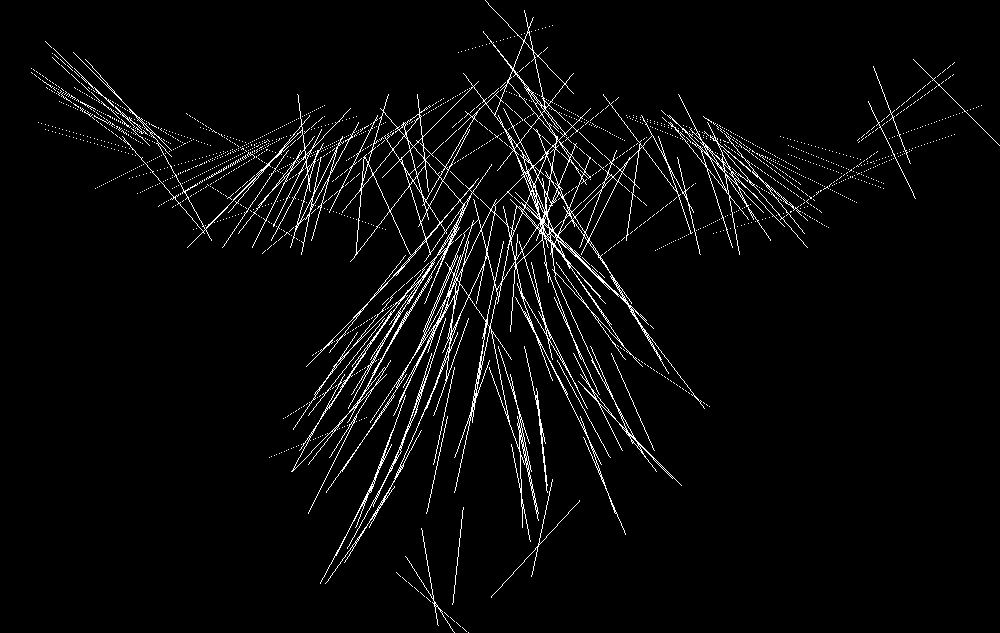
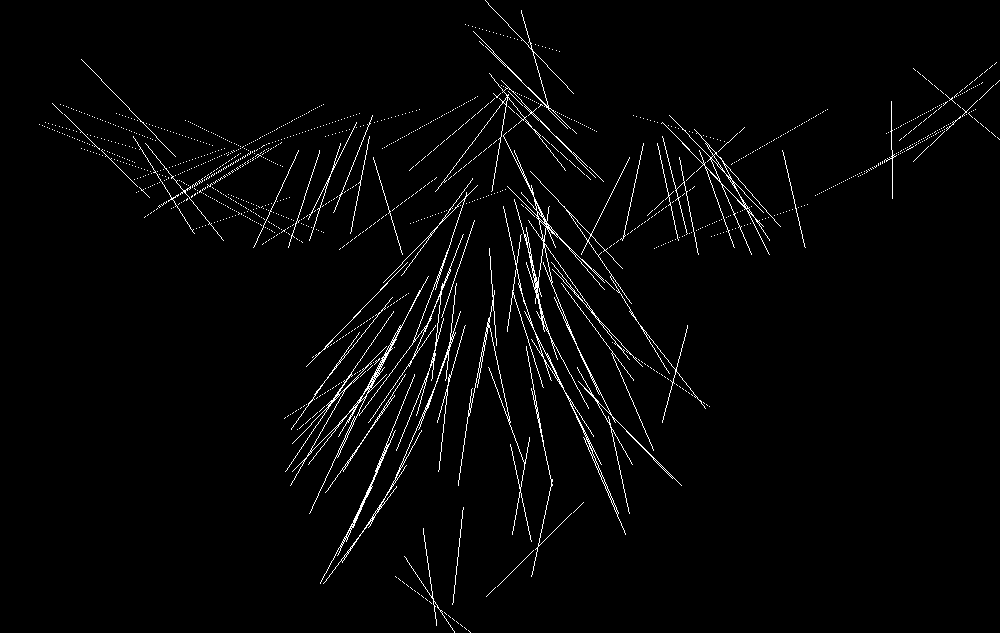
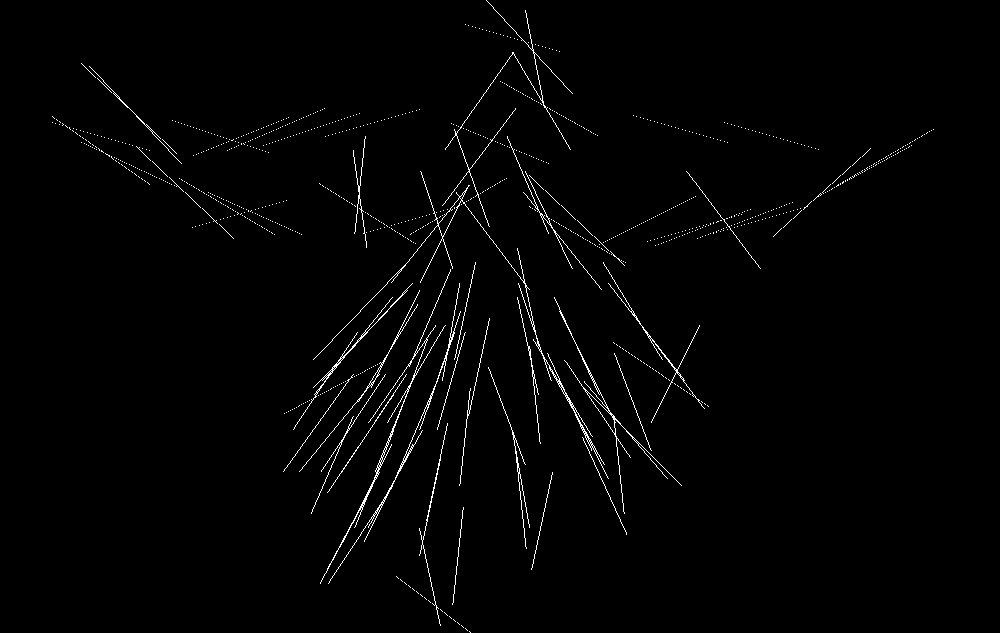
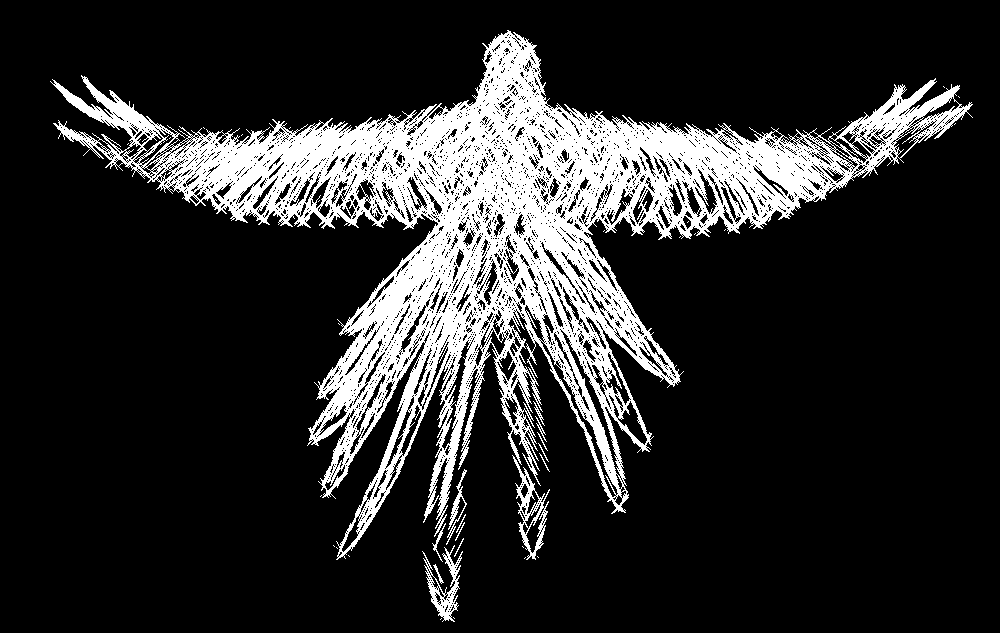
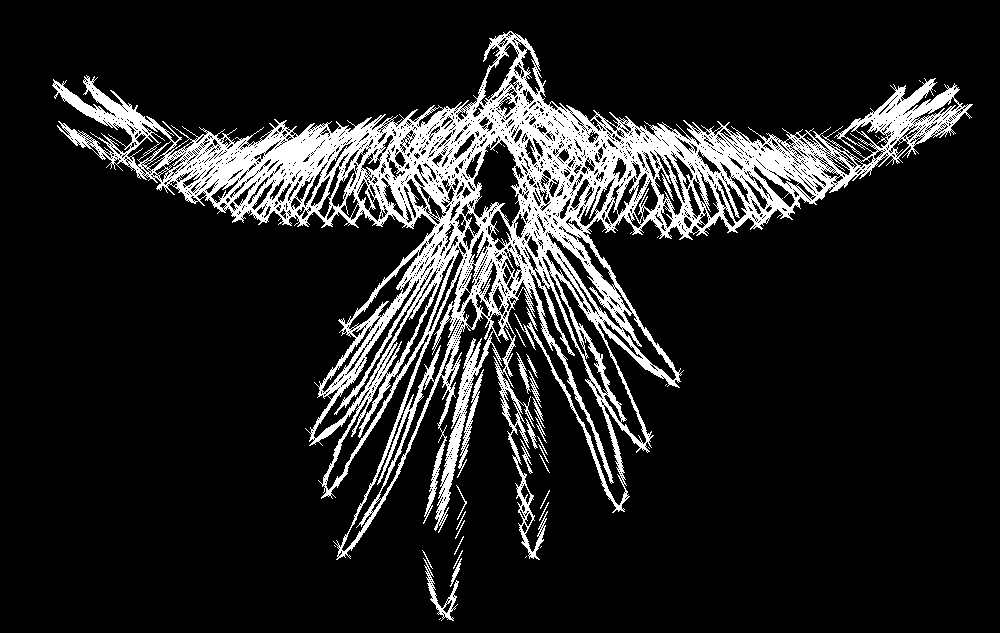
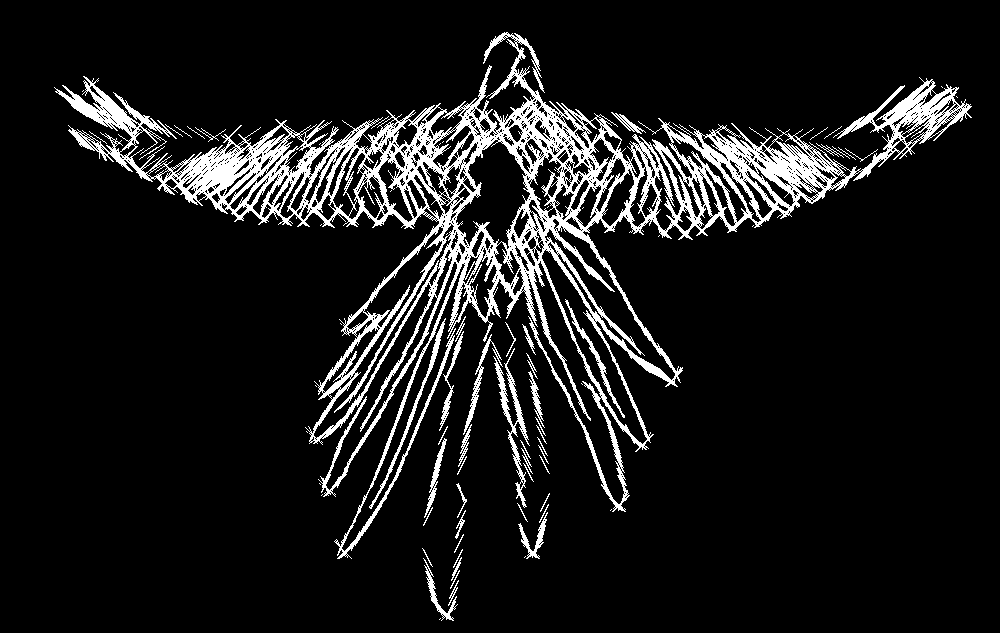
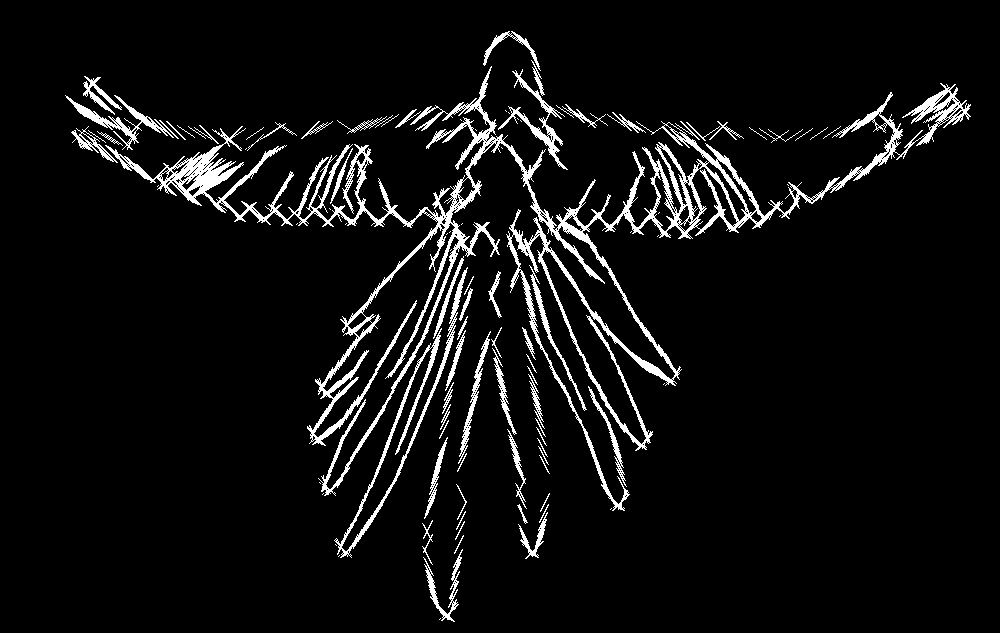
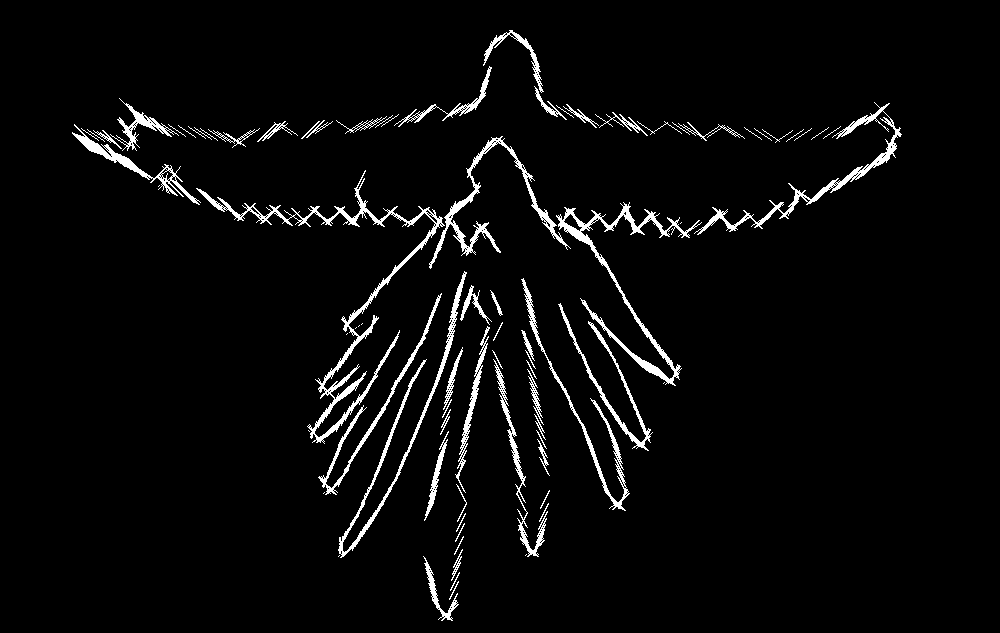
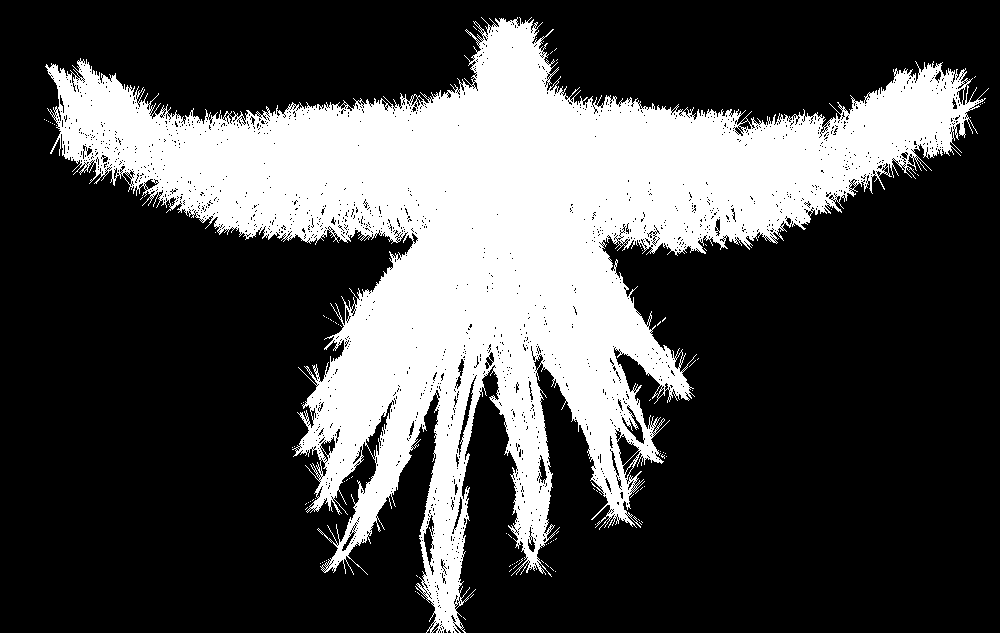
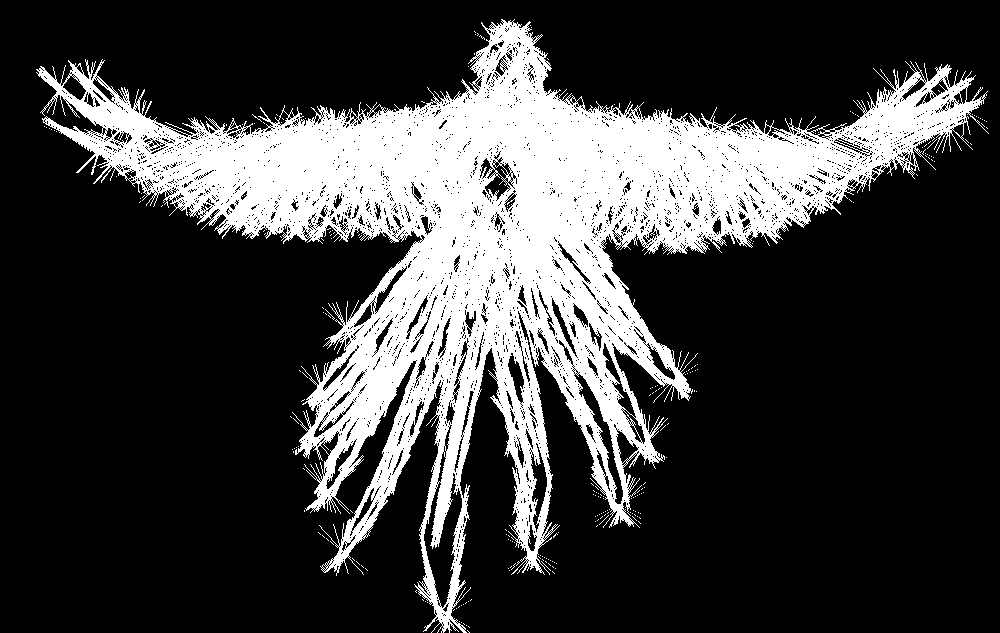
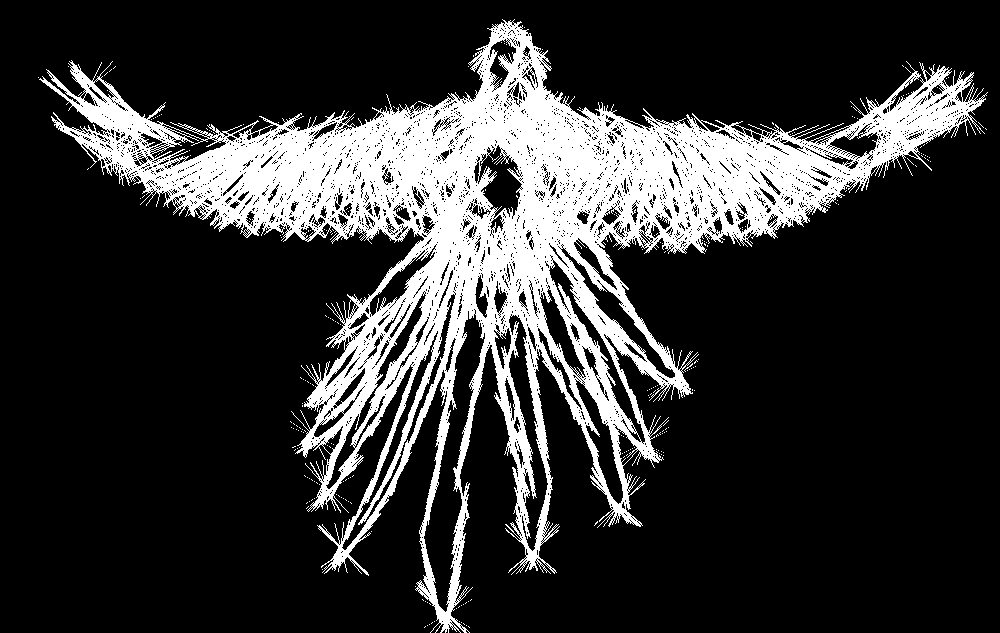
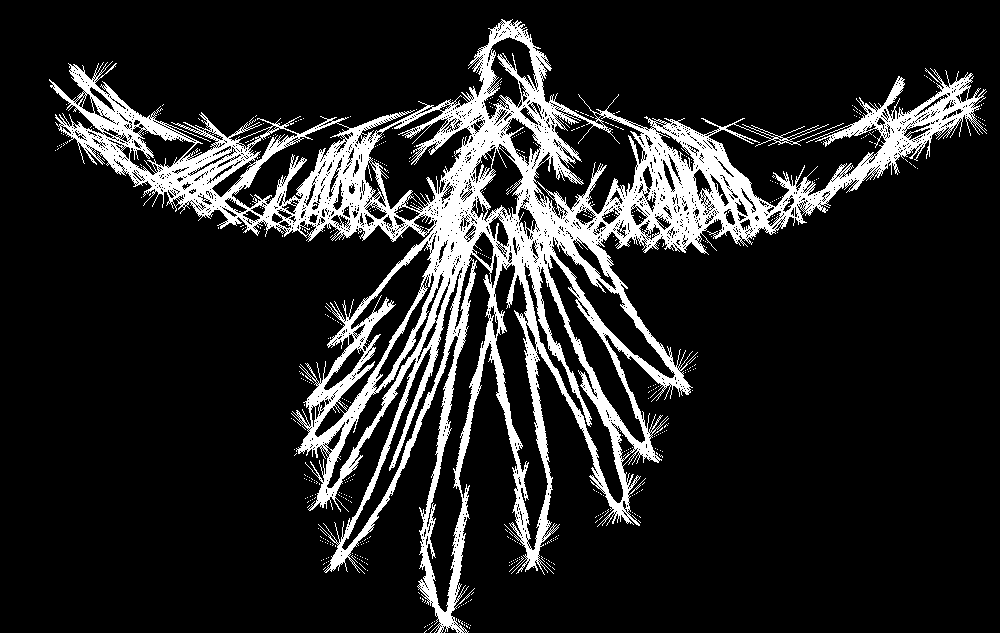
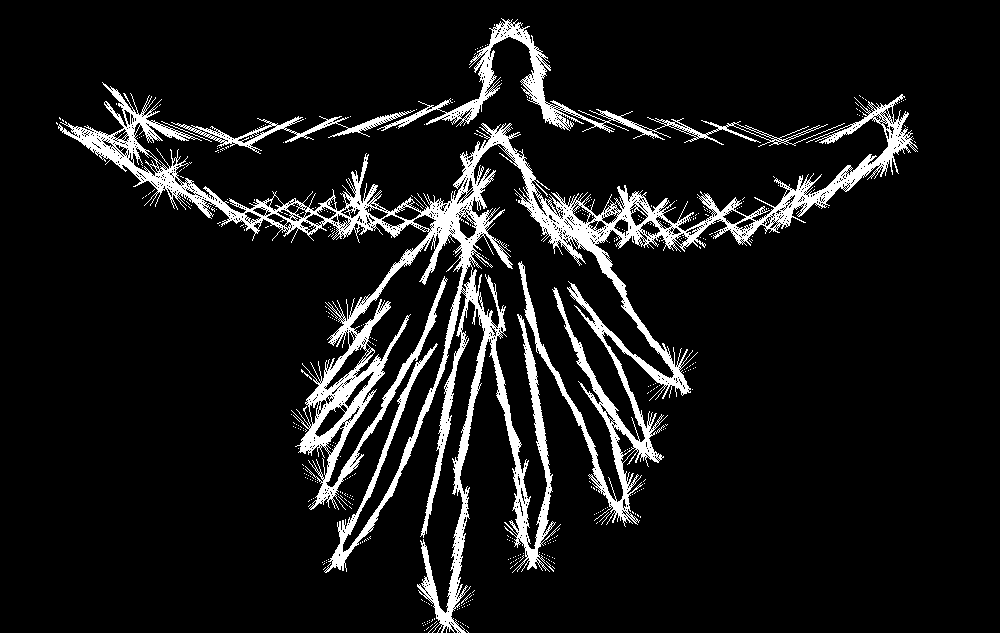
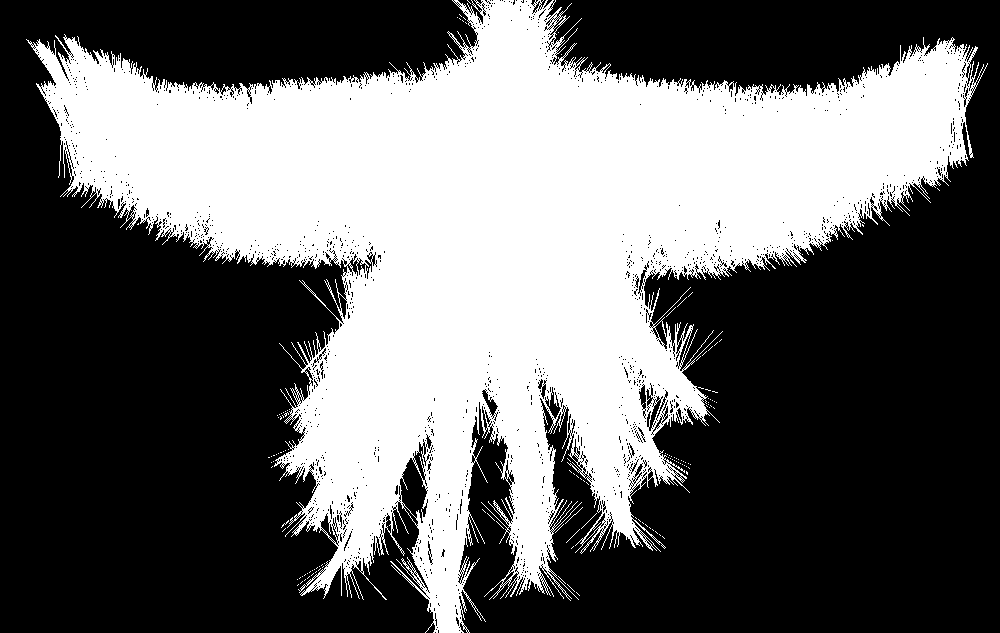
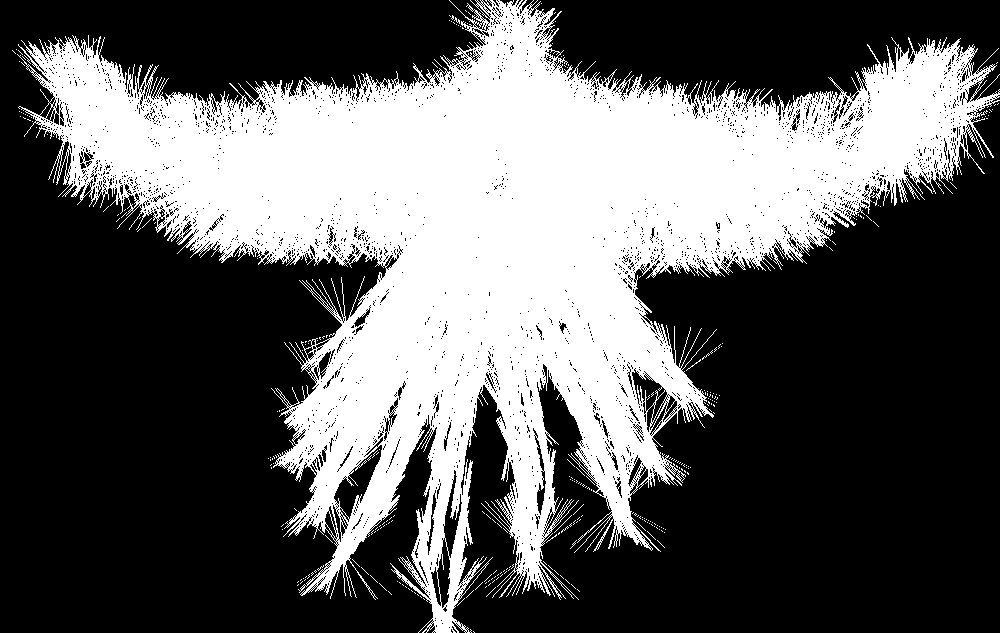
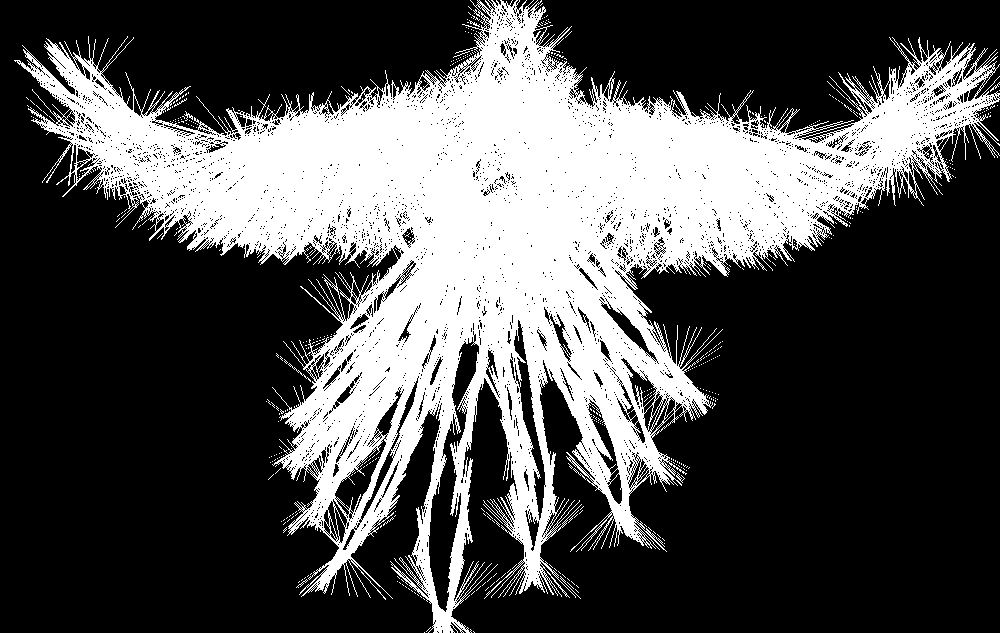
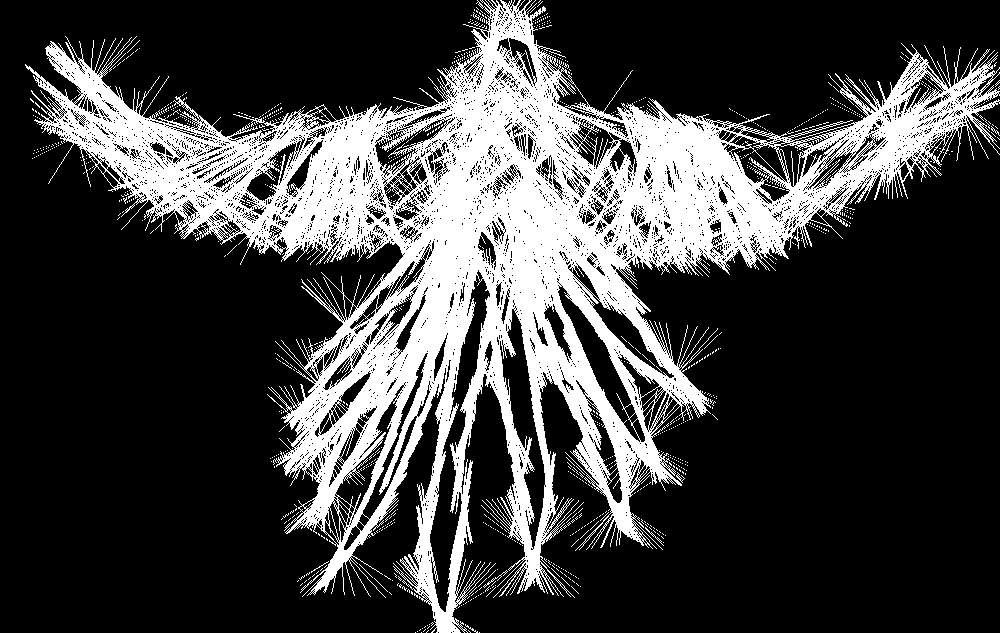
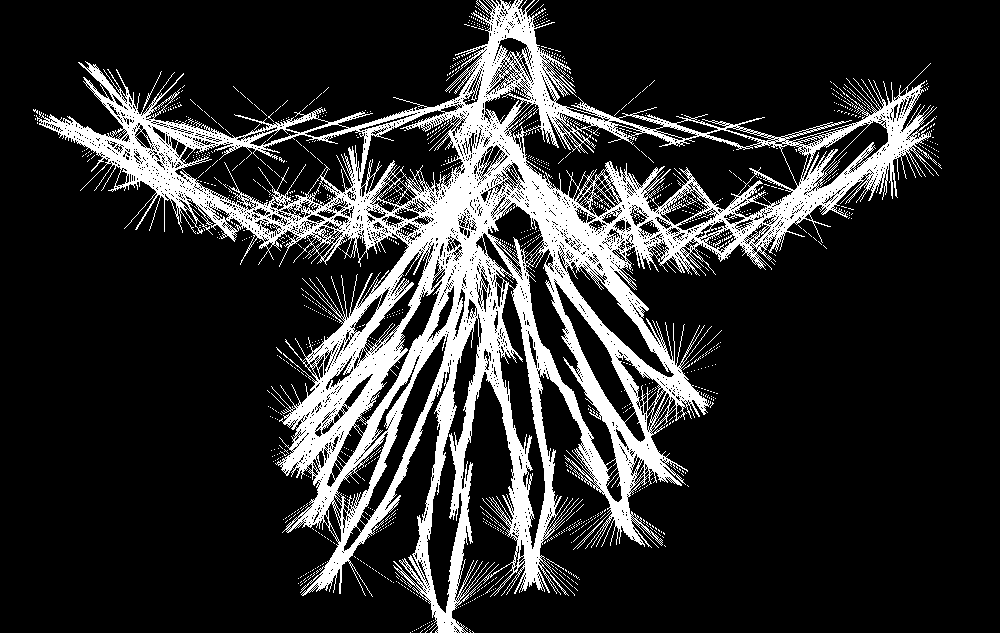
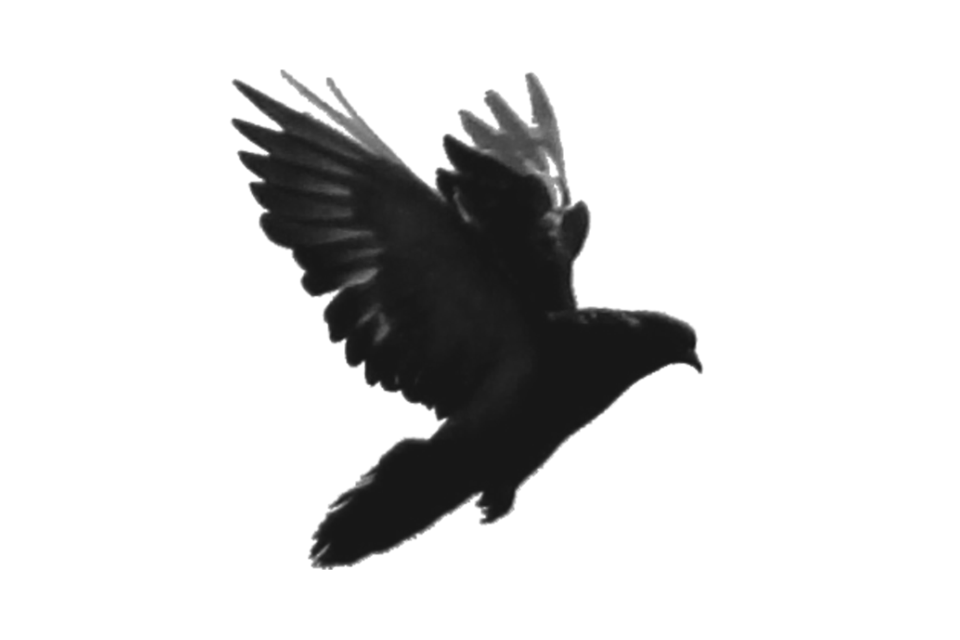
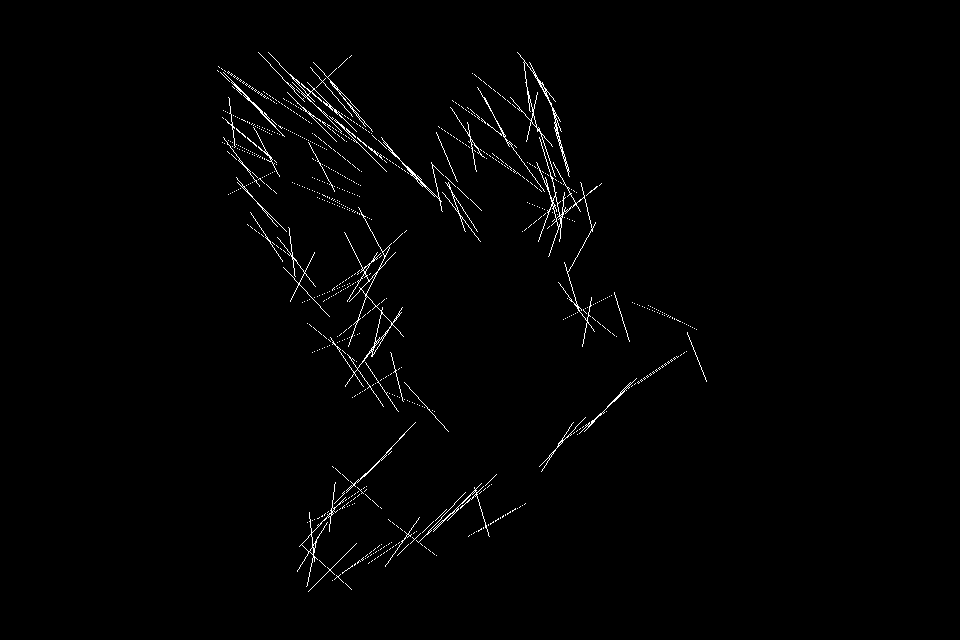
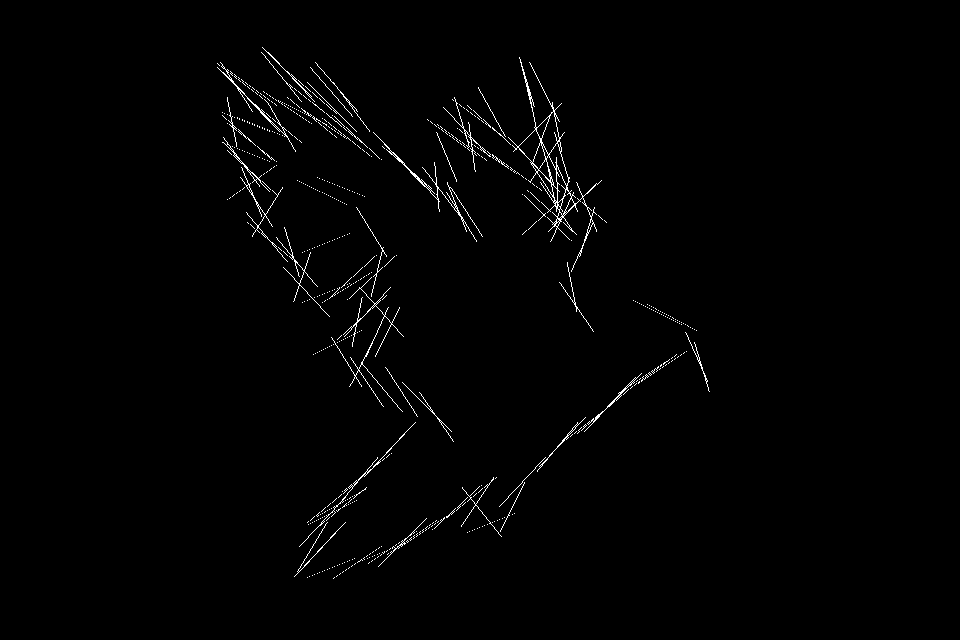
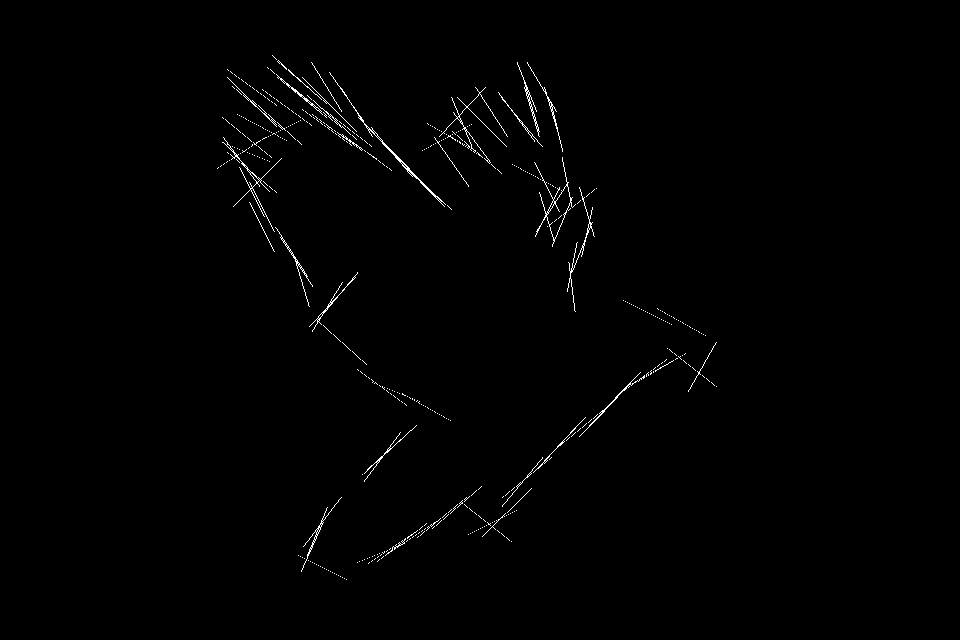
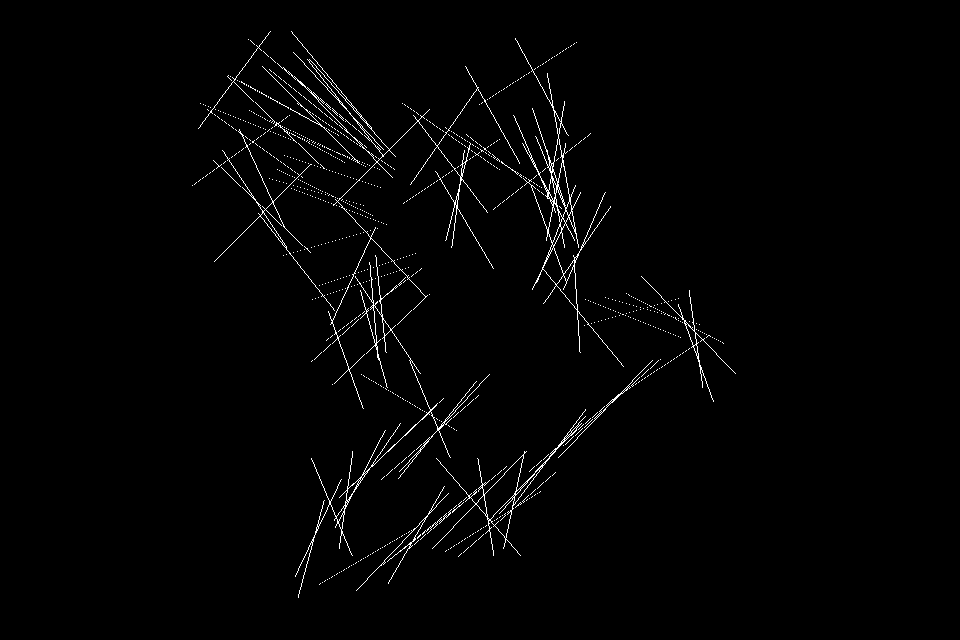
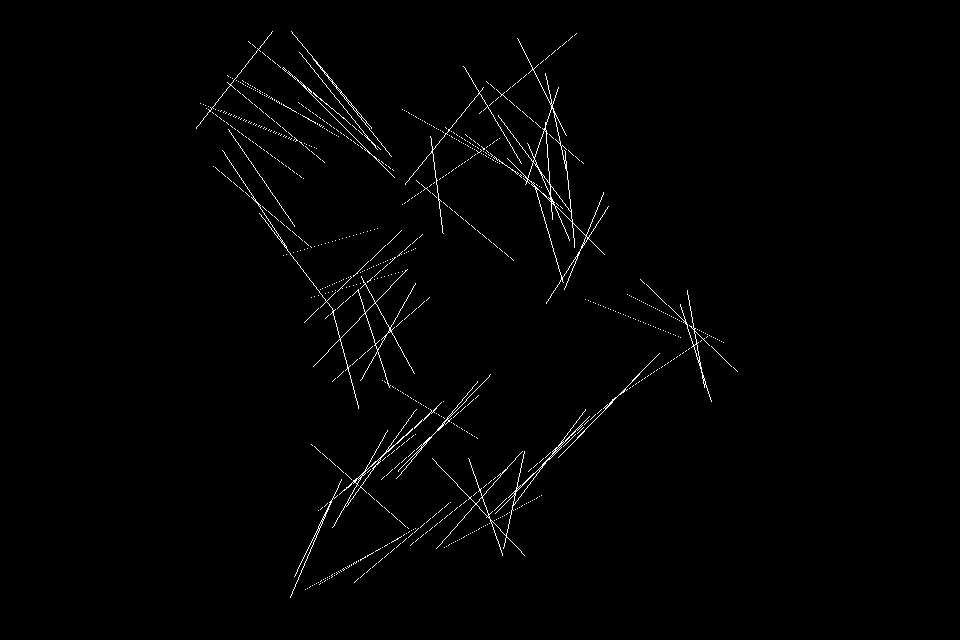
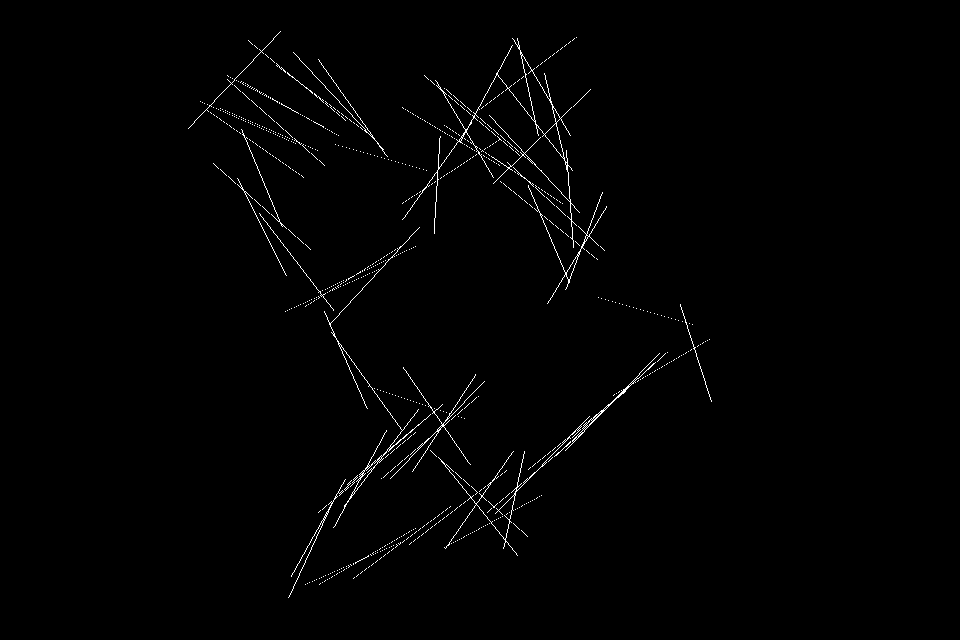
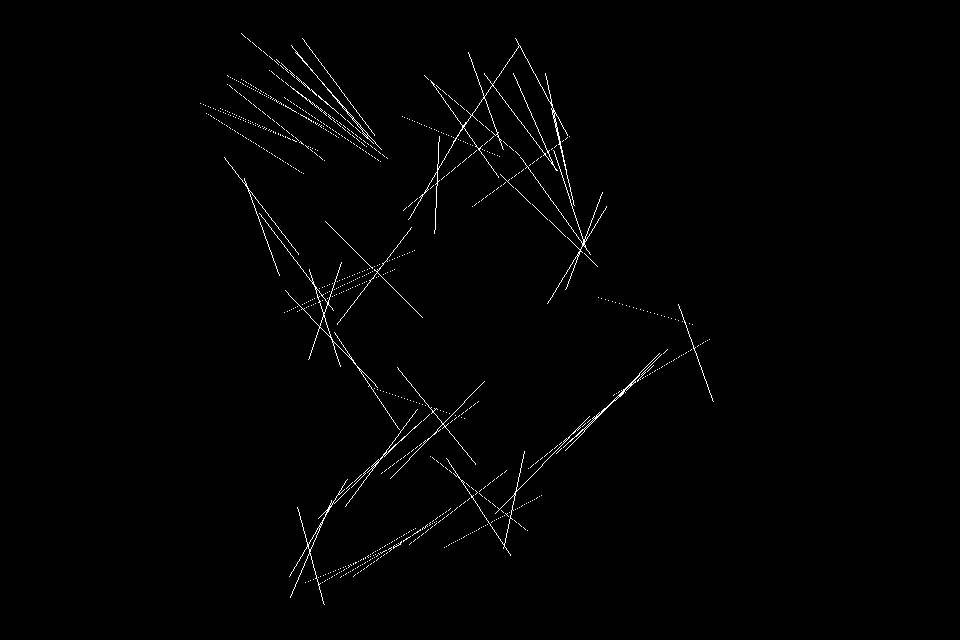
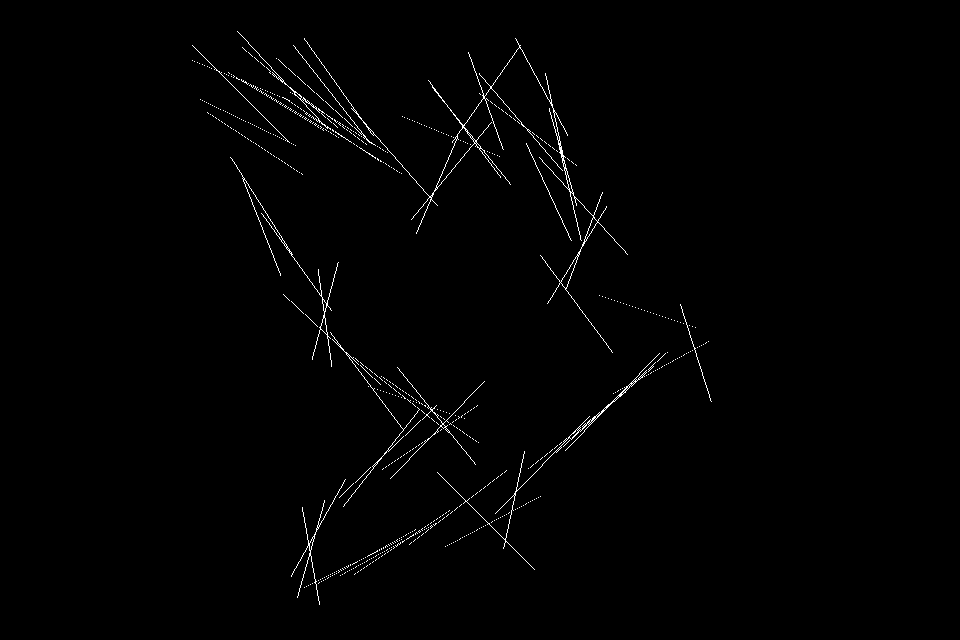
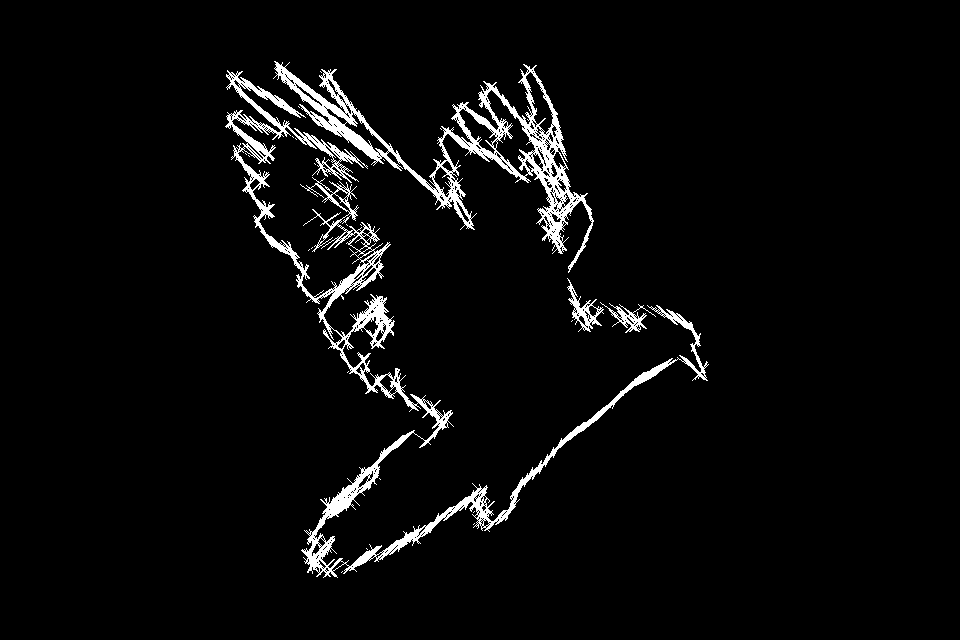
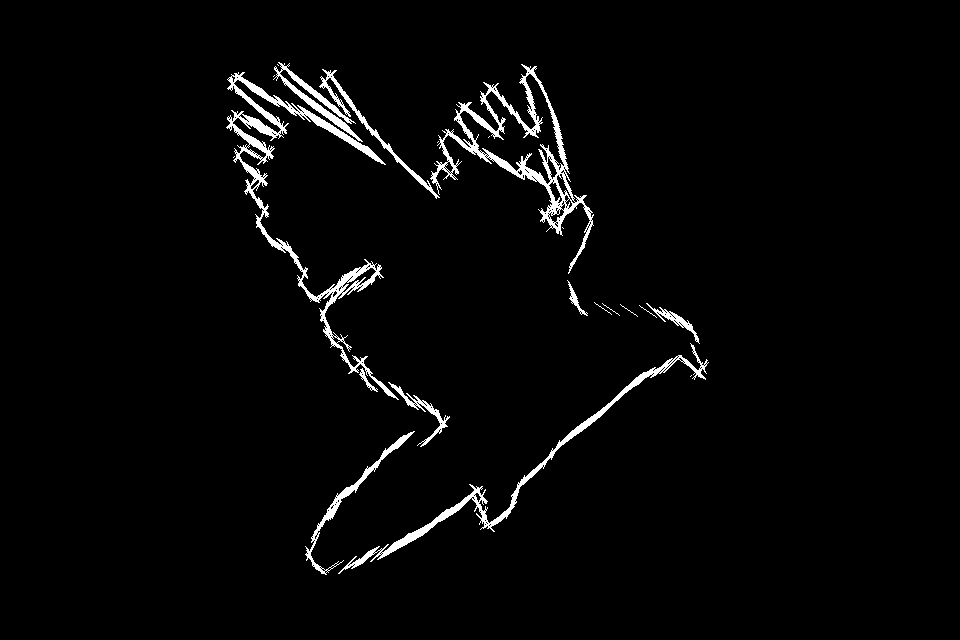
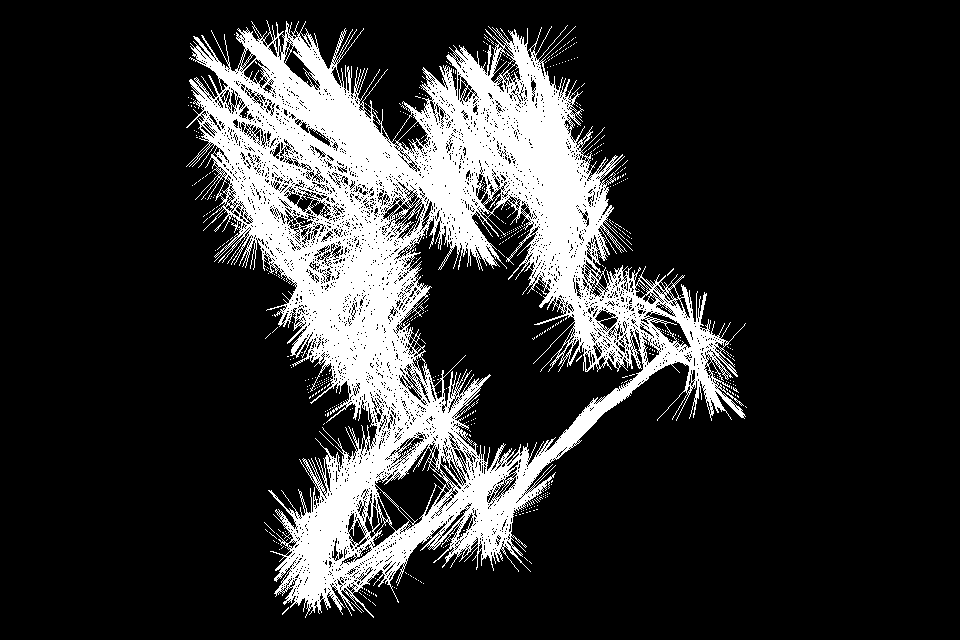
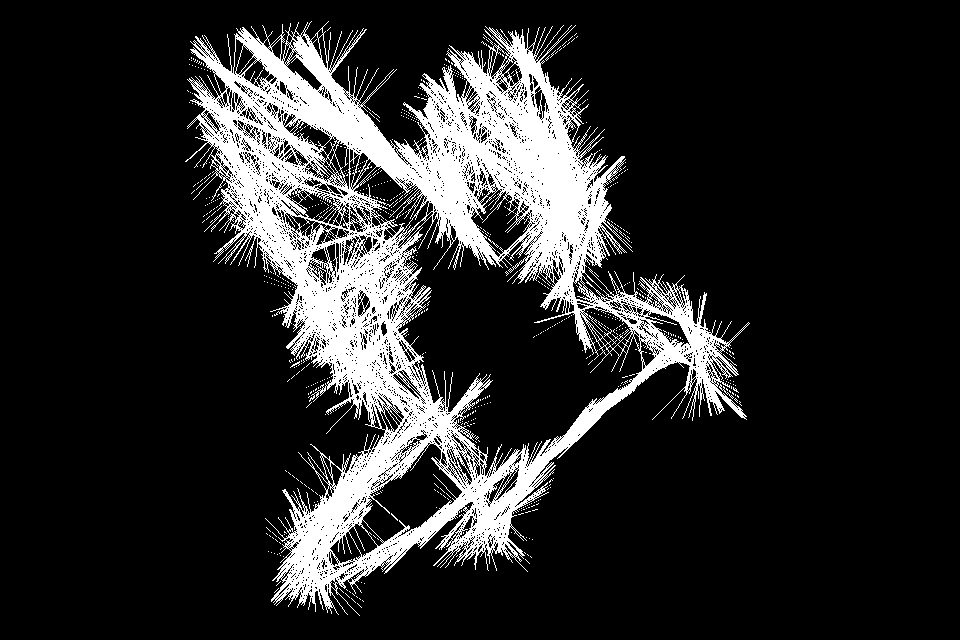
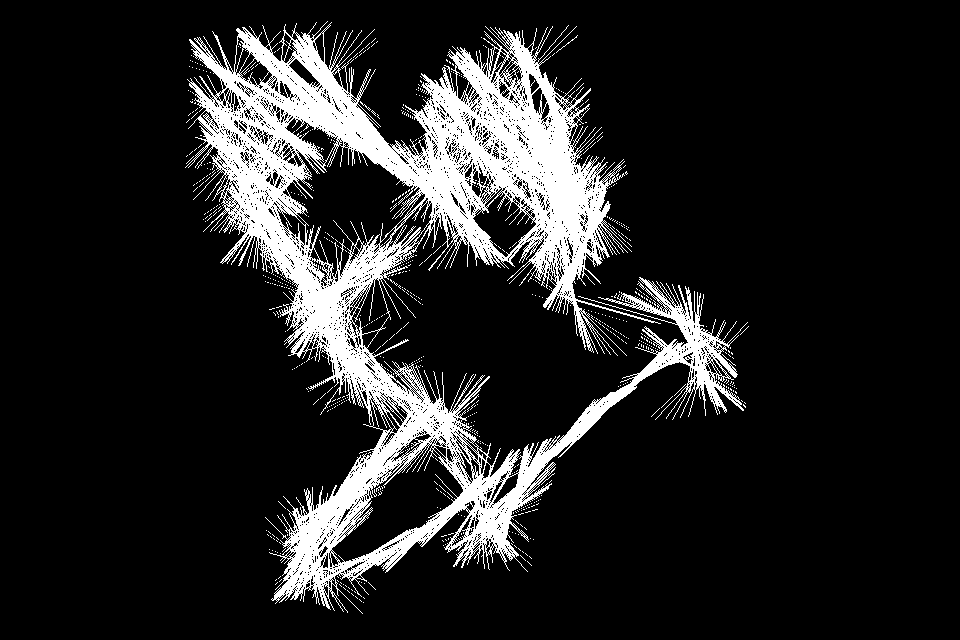
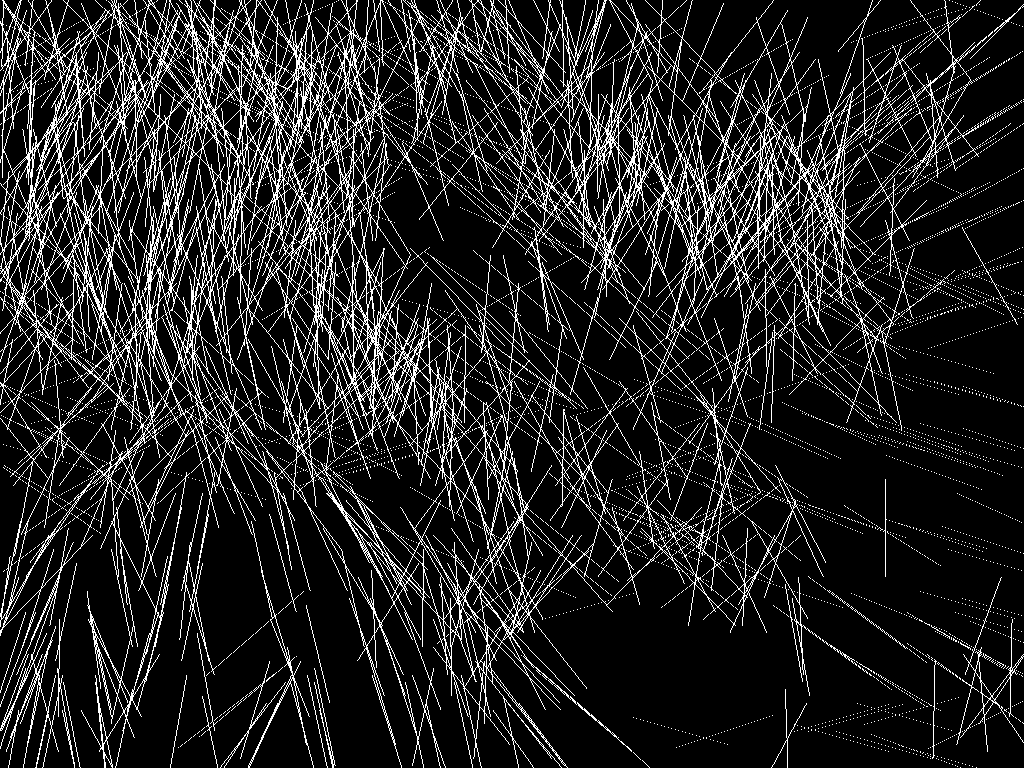
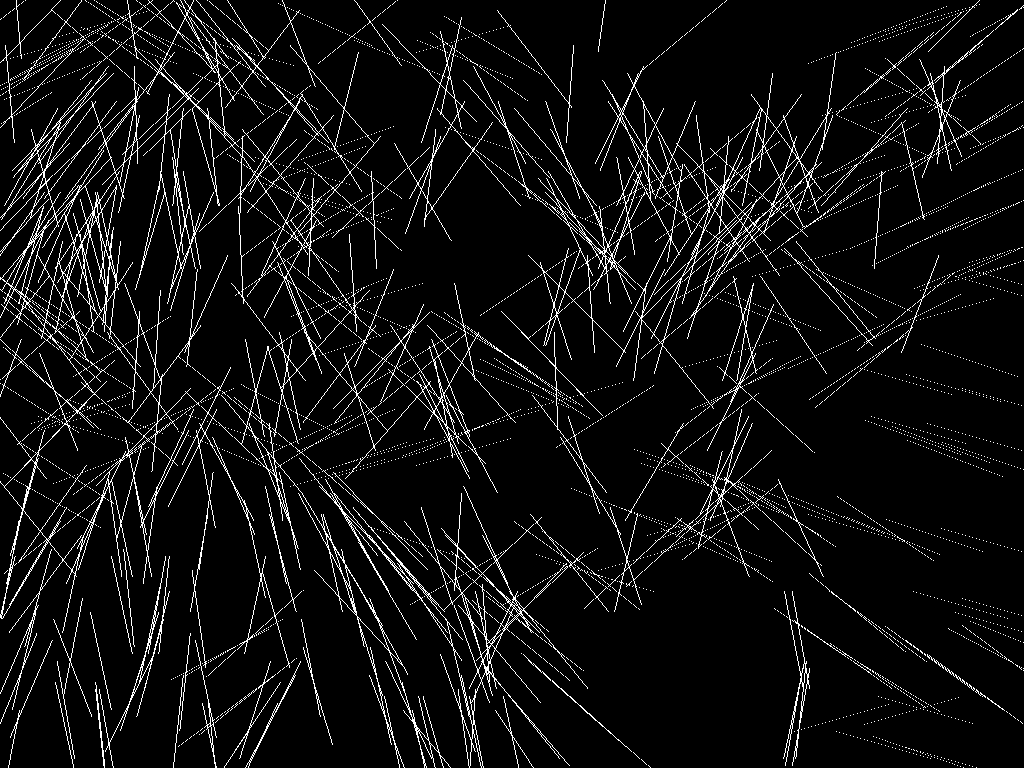
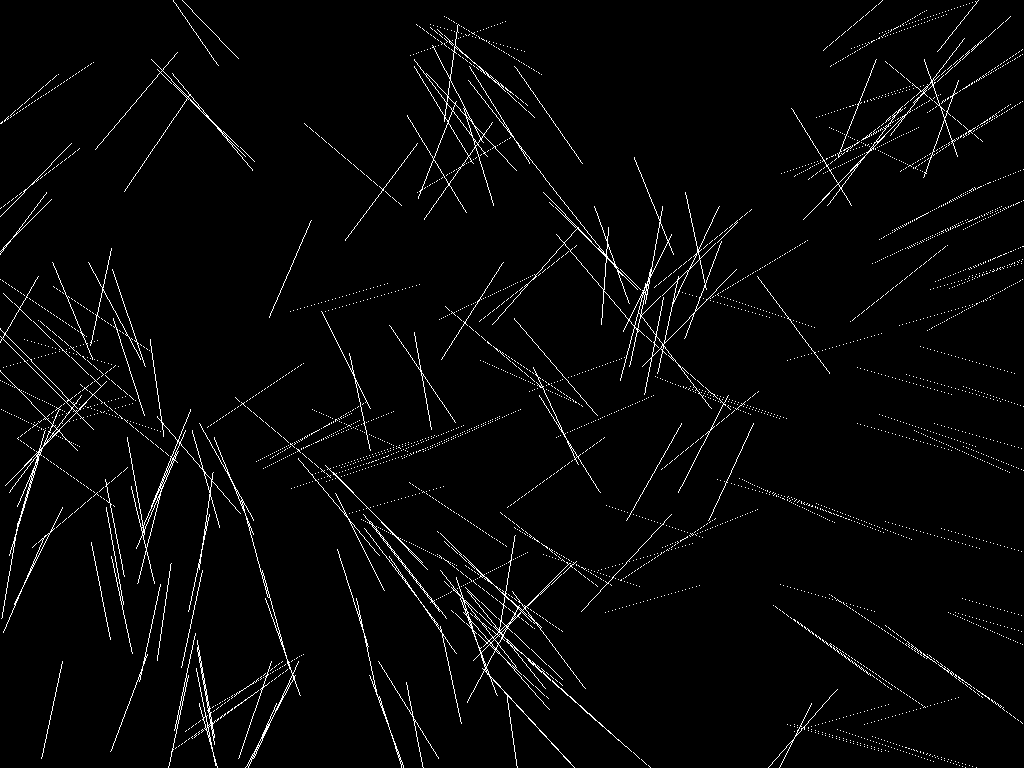
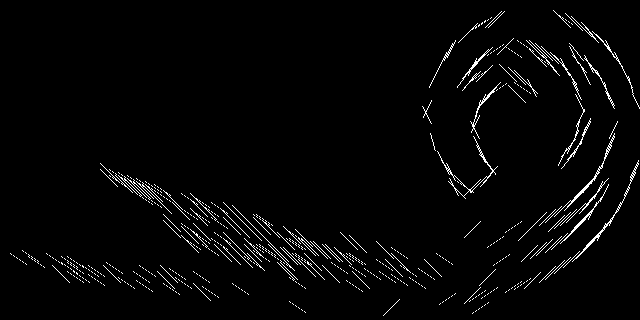
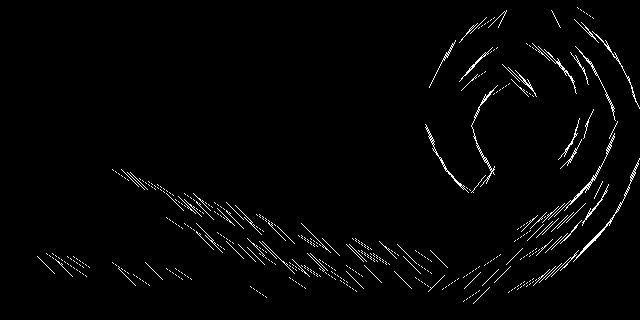
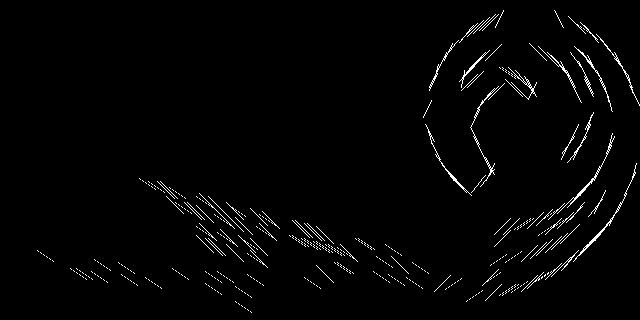
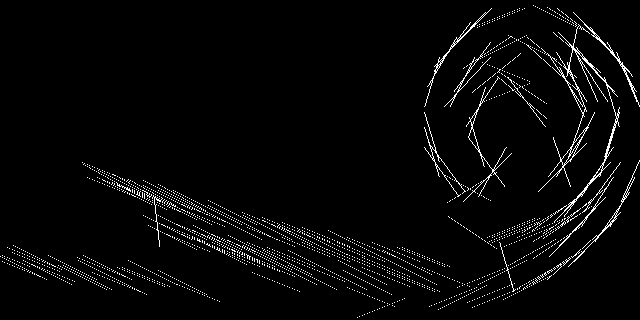
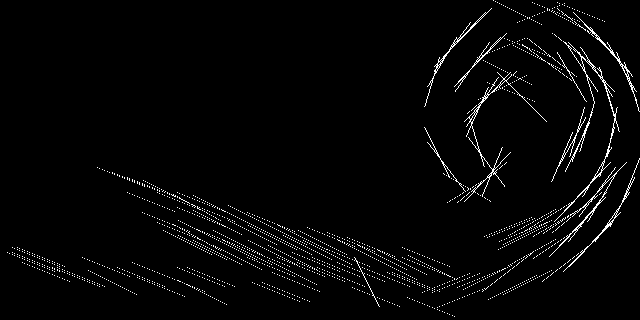
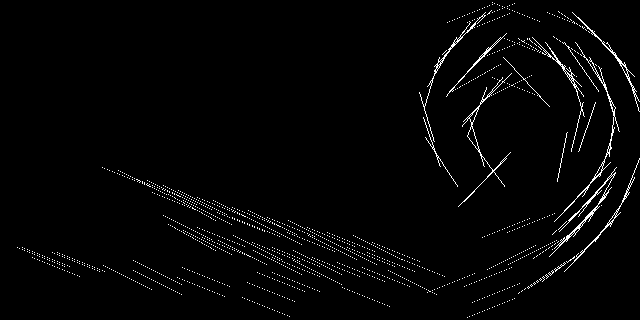
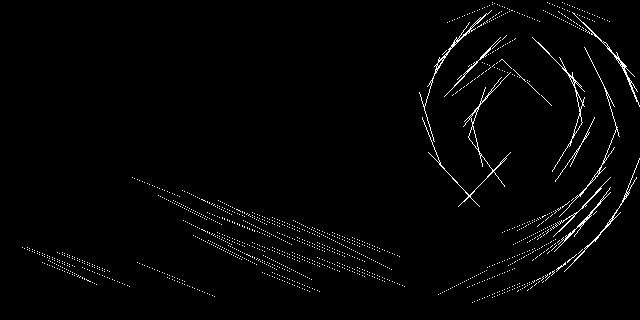
Below we have the output of applying this filter witih a variety of parameters to this image of a bird:
| Sigma = 1 | Sigma = 2 | Sigma = 3 | Sigma = 4 | Sigma = 5 | |
|---|---|---|---|---|---|
| N=3 |
|

|
|
|
|
| N=5 |
|
|
|
|
|
| N=7 |

|
|
|
|
|
| Sigma = 1 | Sigma = 2 | Sigma = 3 | Sigma = 4 | Sigma = 5 | |
|---|---|---|---|---|---|
| N=3 |
|
|
|
|
|
| N=5 |
|
|
|
|
|
| N=7 |
|
|
|
|
|
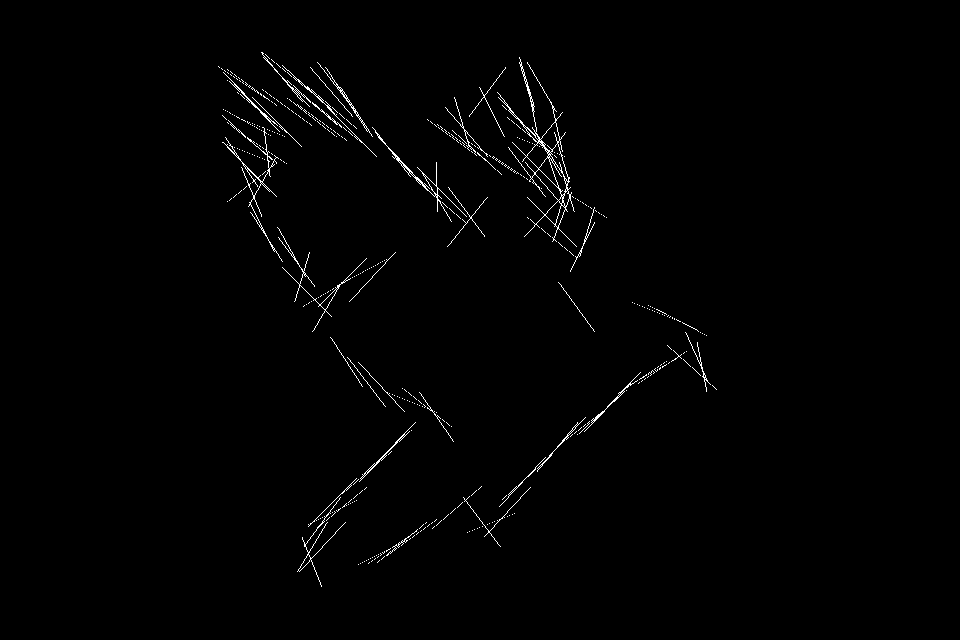
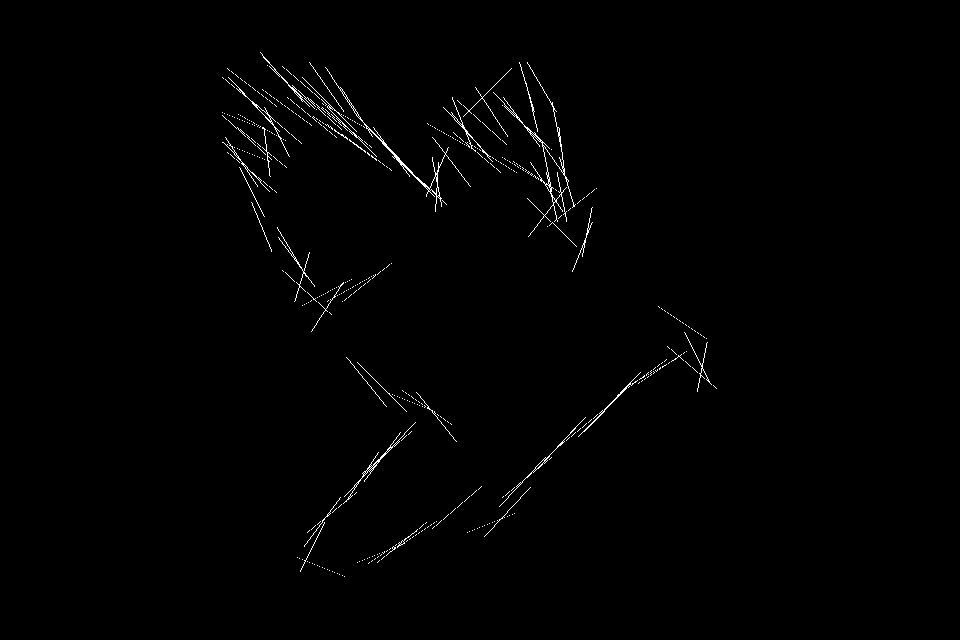
Below we have the output of applying this filter witih a variety of parameters to this image of a bird:
| Sigma = 1 | Sigma = 2 | Sigma = 3 | Sigma = 4 | Sigma = 5 | |
|---|---|---|---|---|---|
| N=3 |
|
|
|
|
|
| N=5 |
|
|
|
|
|
| N=7 |
|
|
|
|
|
| Sigma = 1 | Sigma = 2 | Sigma = 3 | Sigma = 4 | Sigma = 5 | |
|---|---|---|---|---|---|
| N=3 |
|
|
|
|
|
| N=5 |
|
|
|
|
|
| N=7 |
|
|
|
|
|
Below we have the output of applying this filter witih a variety of parameters to this image of a bird:
| Sigma = 1 | Sigma = 2 | Sigma = 3 | Sigma = 4 | Sigma = 5 | |
|---|---|---|---|---|---|
| N=3 |

|
|

|
|
|
| N=5 |
|
|
|
|
|
| N=7 |
|
|
|
|
|
| Sigma = 1 | Sigma = 2 | Sigma = 3 | Sigma = 4 | Sigma = 5 | |
|---|---|---|---|---|---|
| N=3 |
|

|

|
|
|
| N=5 |
|

|
|
|
|
| N=7 |
|
|
|

|
|
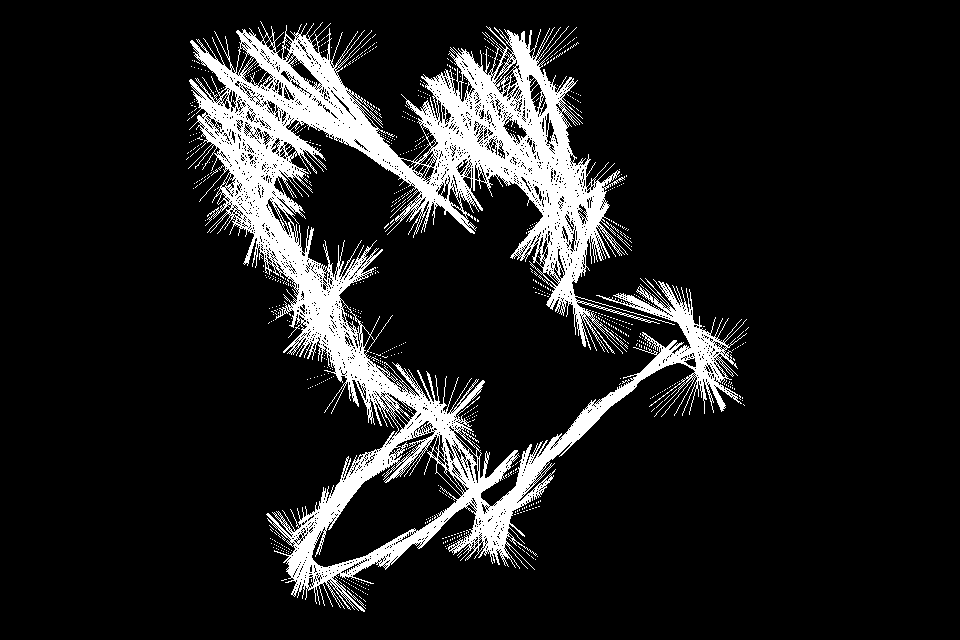
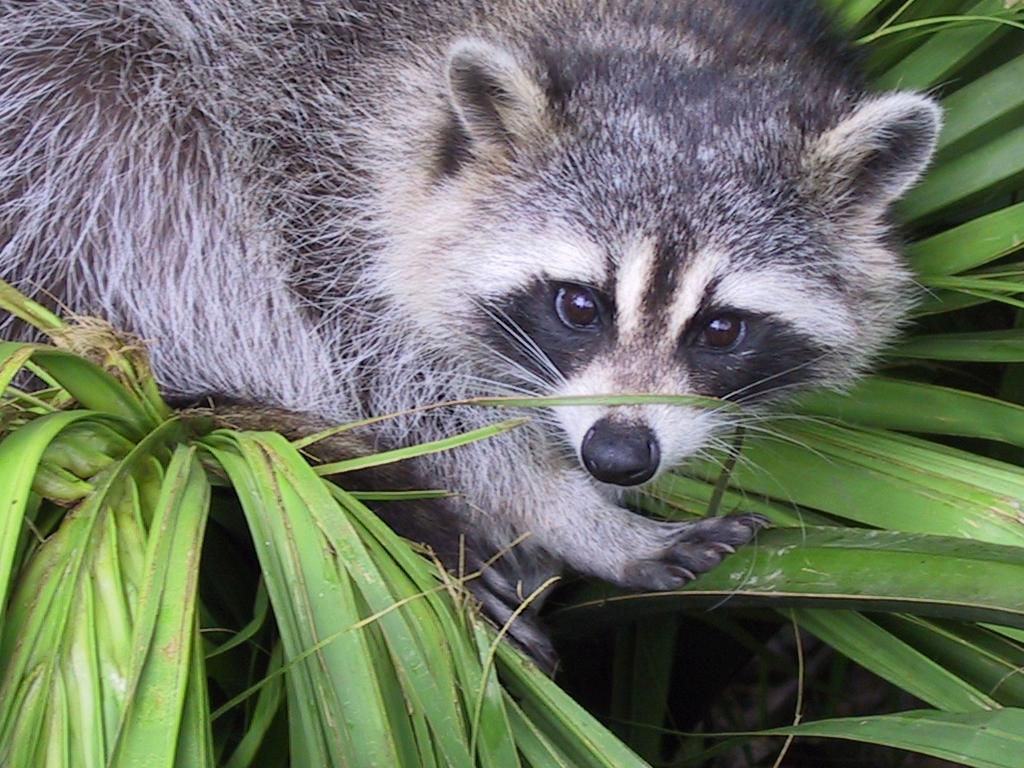
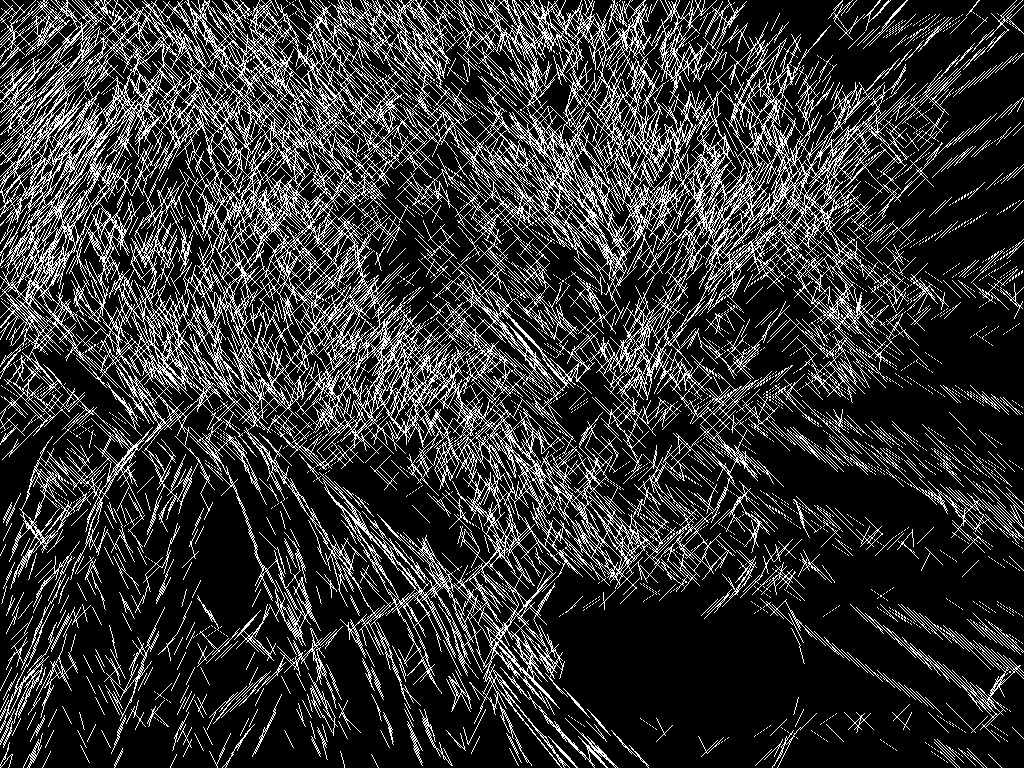
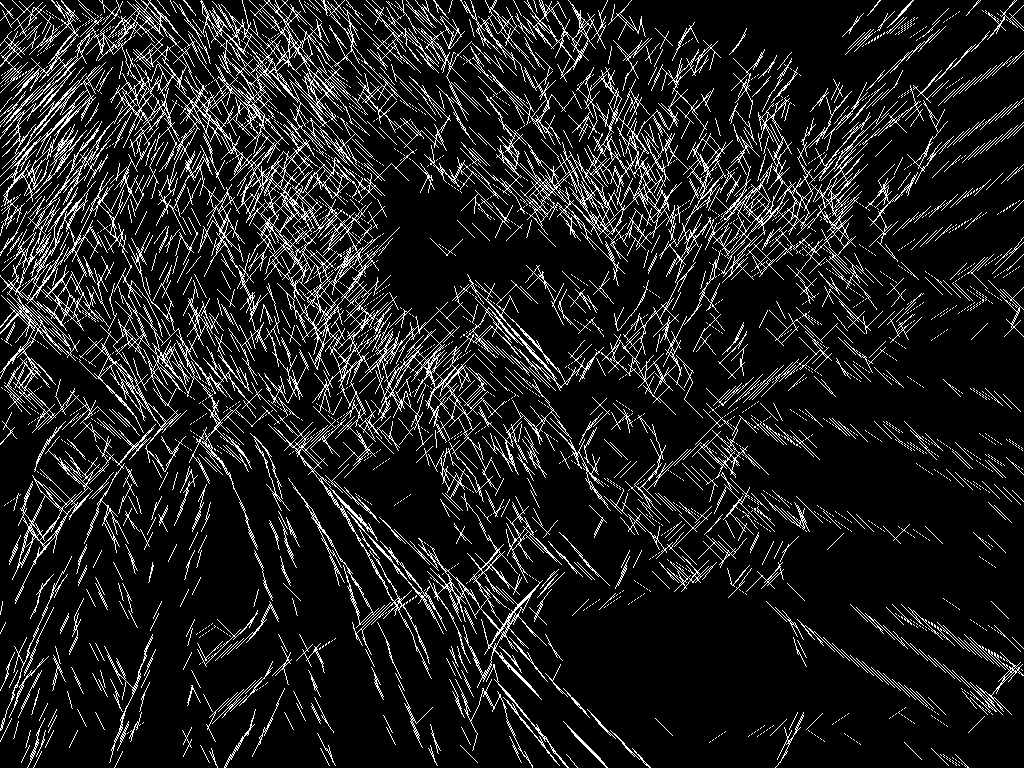
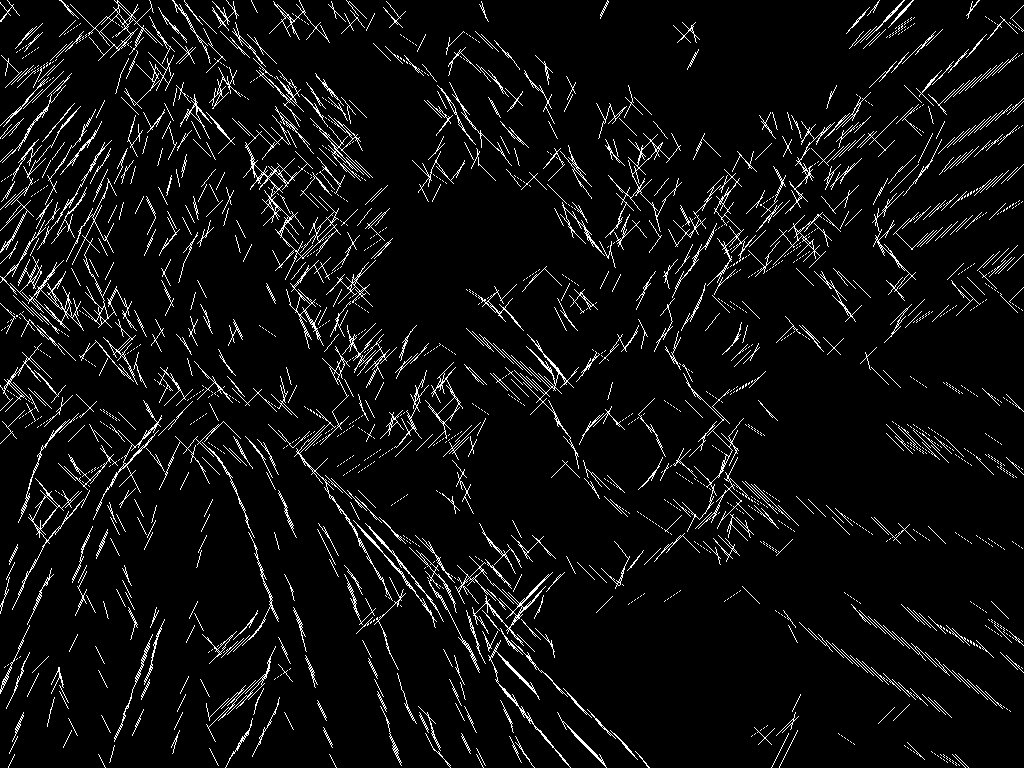
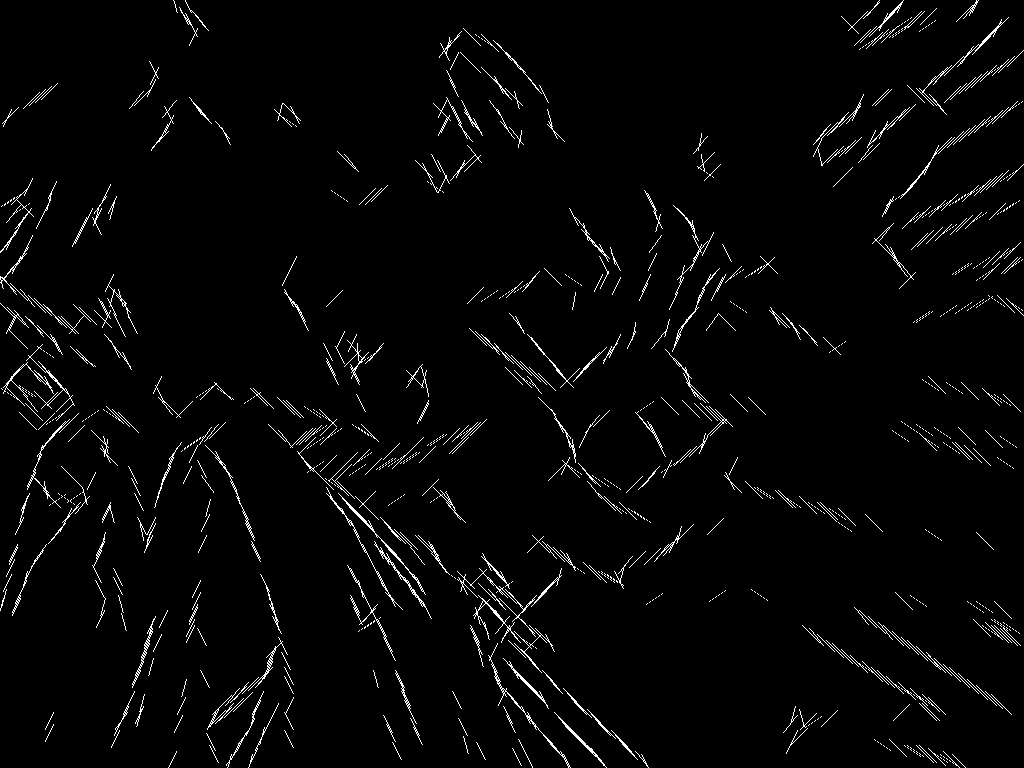
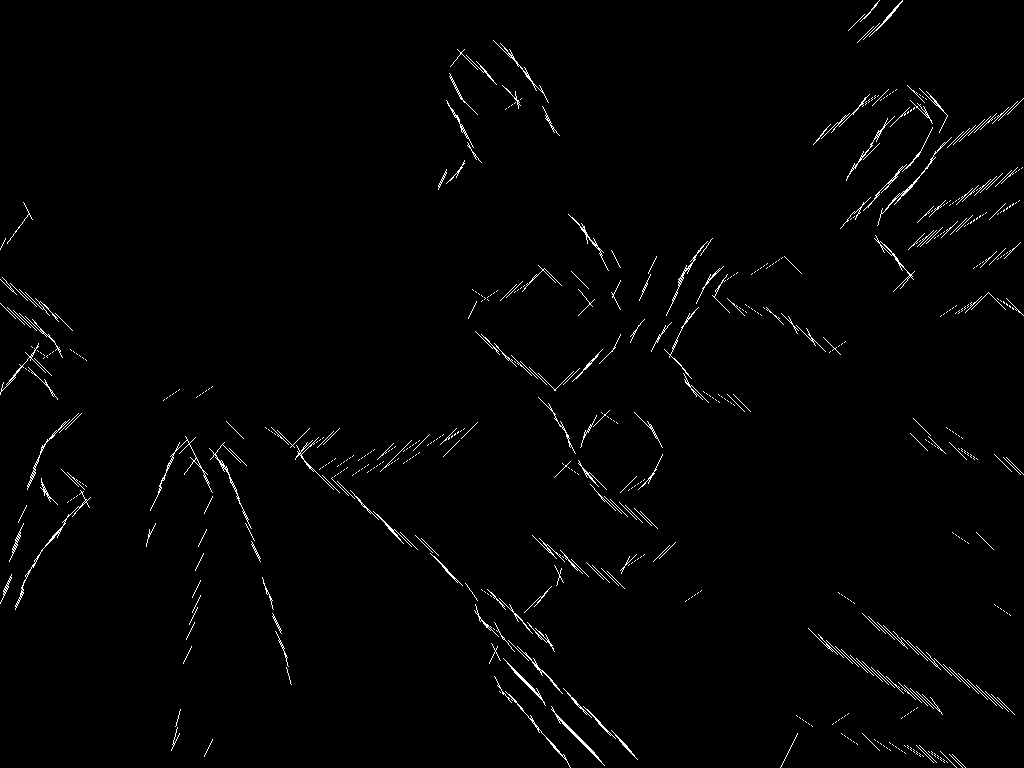
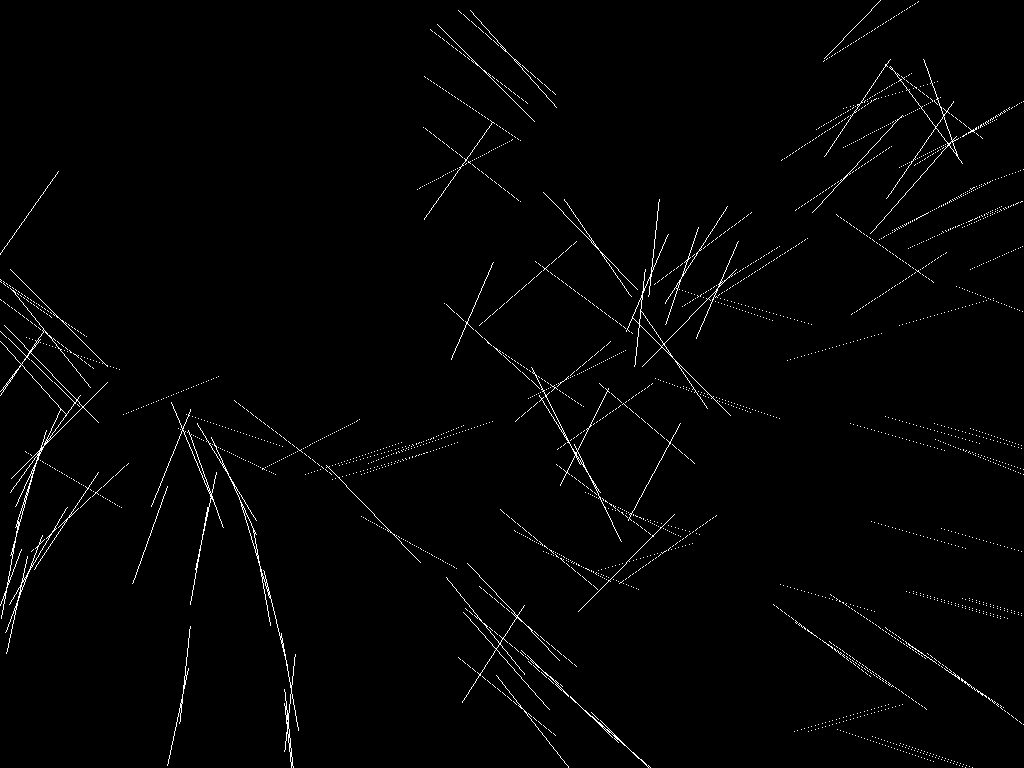
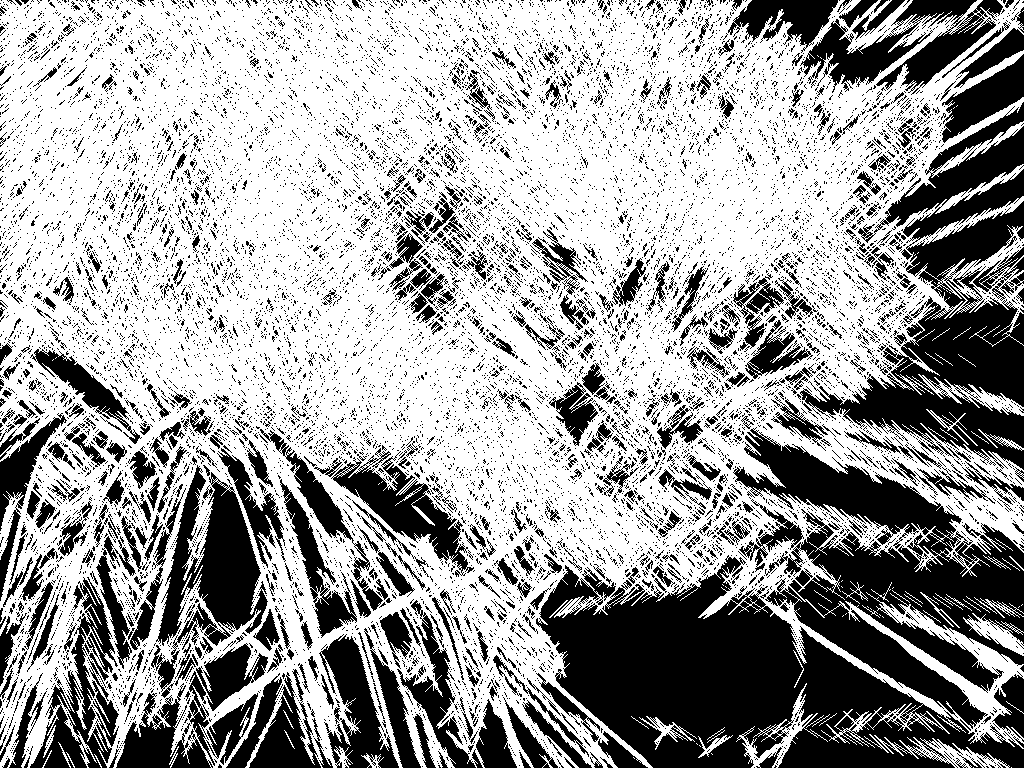
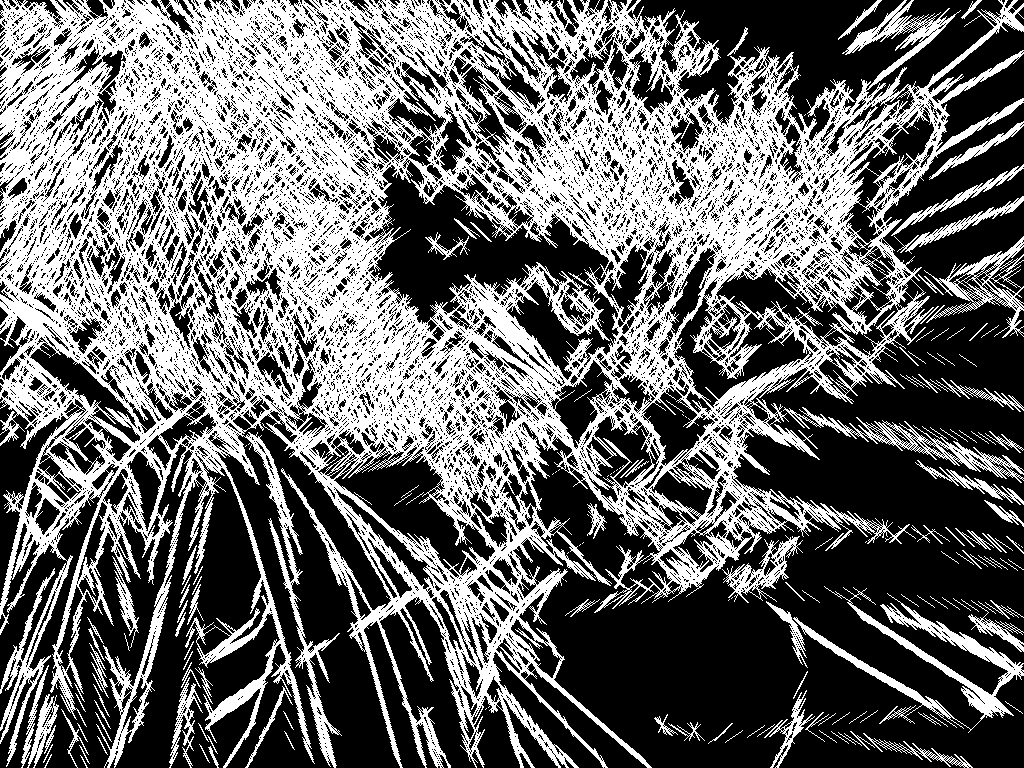
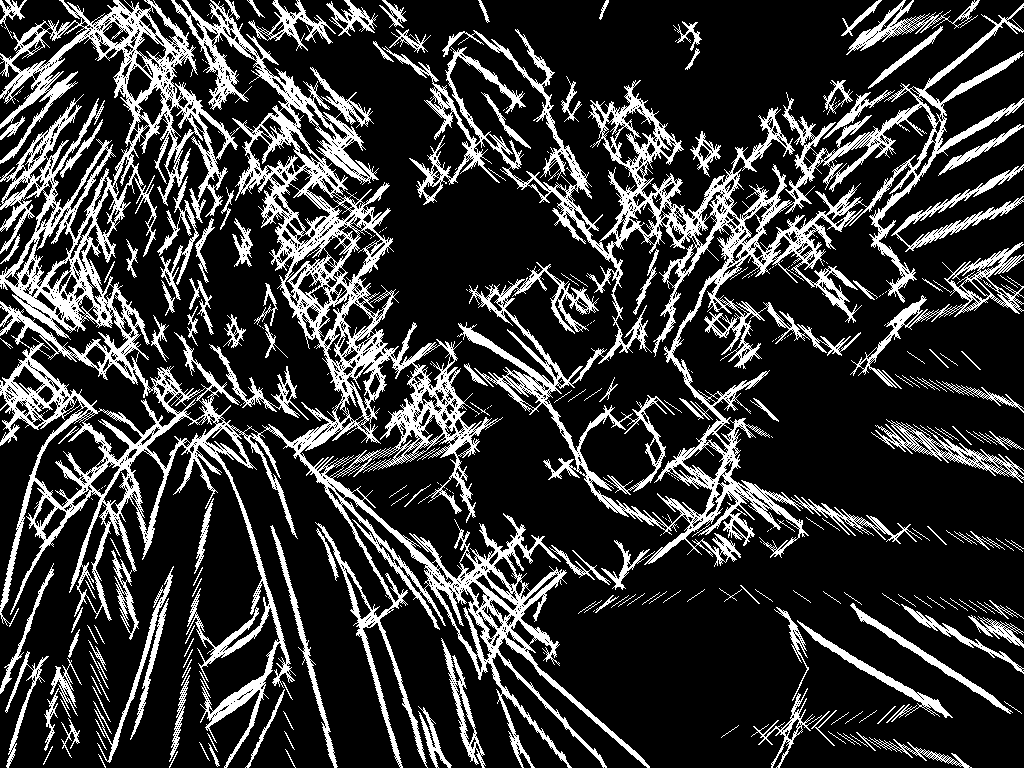
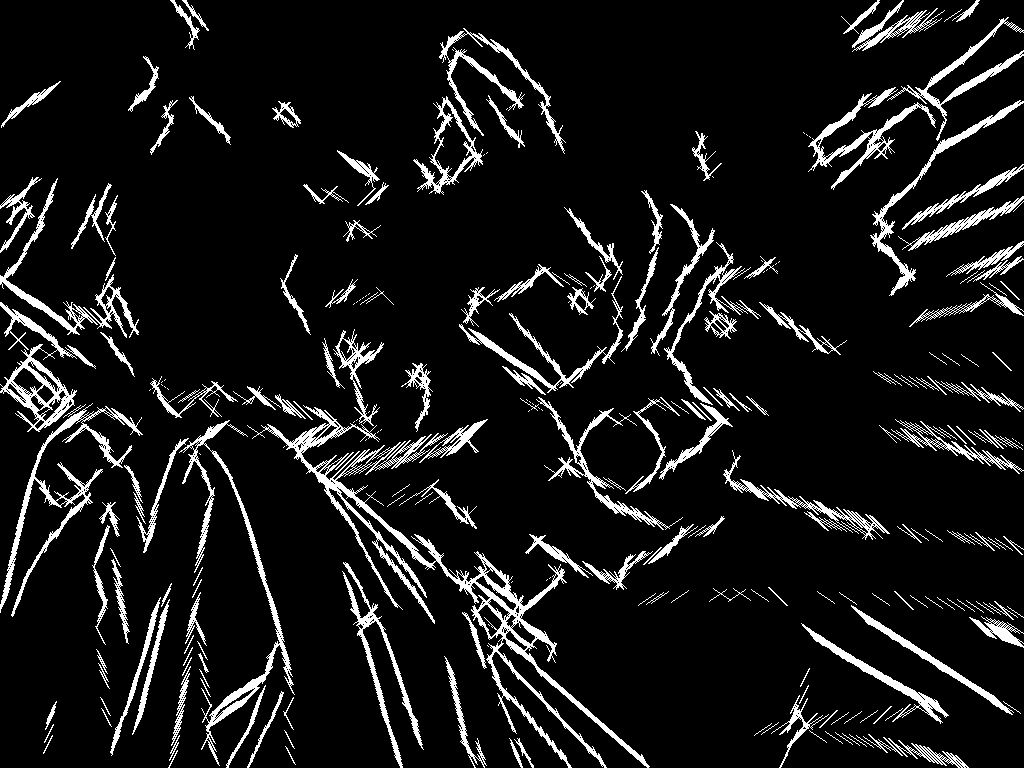
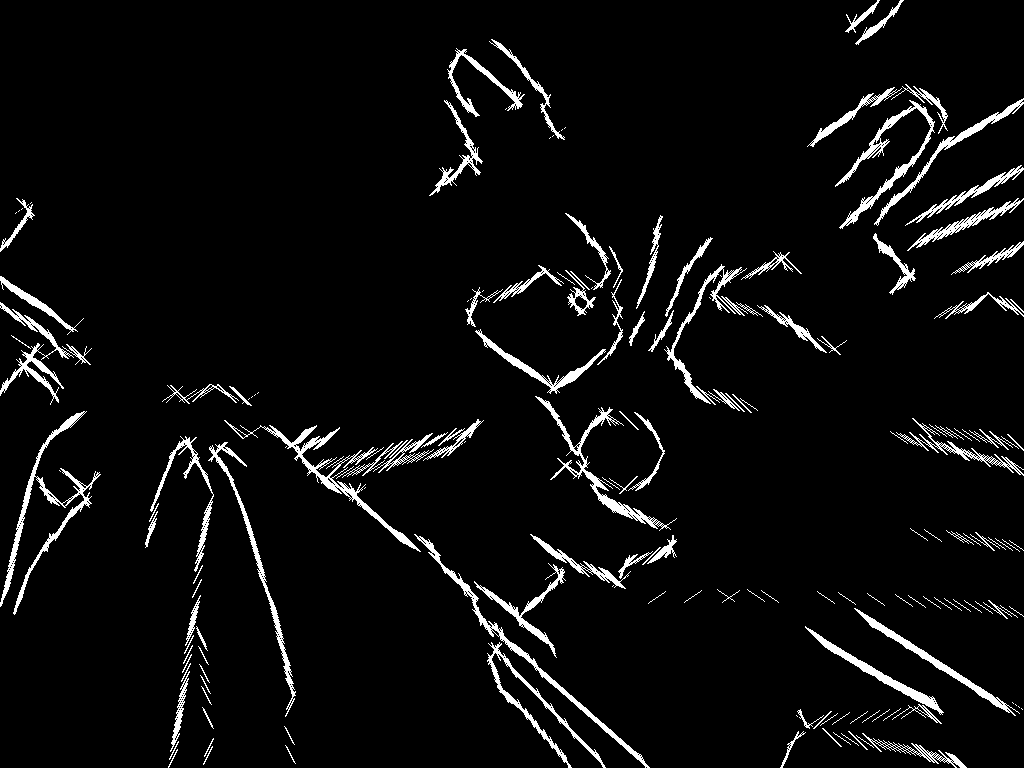
Below we have the output of applying this filter witih a variety of parameters to this image of a racoon:
| Sigma = 1 | Sigma = 2 | Sigma = 3 | Sigma = 4 | Sigma = 5 | |
|---|---|---|---|---|---|
| N=3 |
|
|
|
|
|
| N=5 |
|
|
|
|
|
| N=7 |
|
|
|
|
|
| Sigma = 1 | Sigma = 2 | Sigma = 3 | Sigma = 4 | Sigma = 5 | |
|---|---|---|---|---|---|
| N=3 |
|
|
|
|
|
| N=5 |
|
|
|
|
|
| N=7 |
|
|
|
|
|
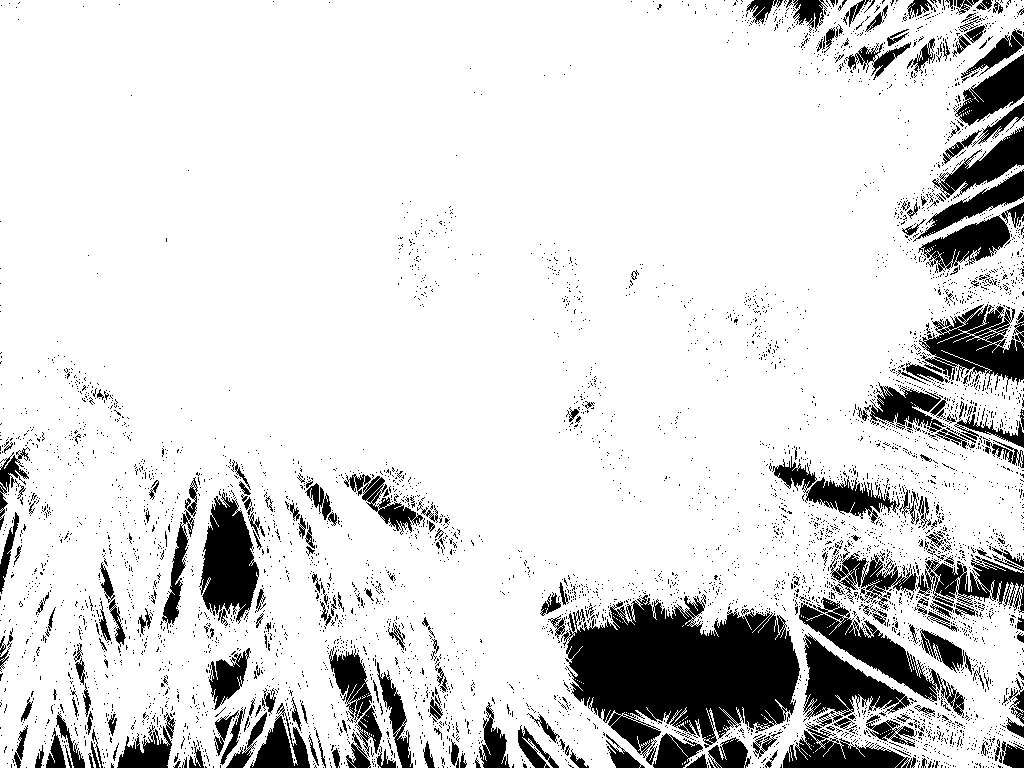
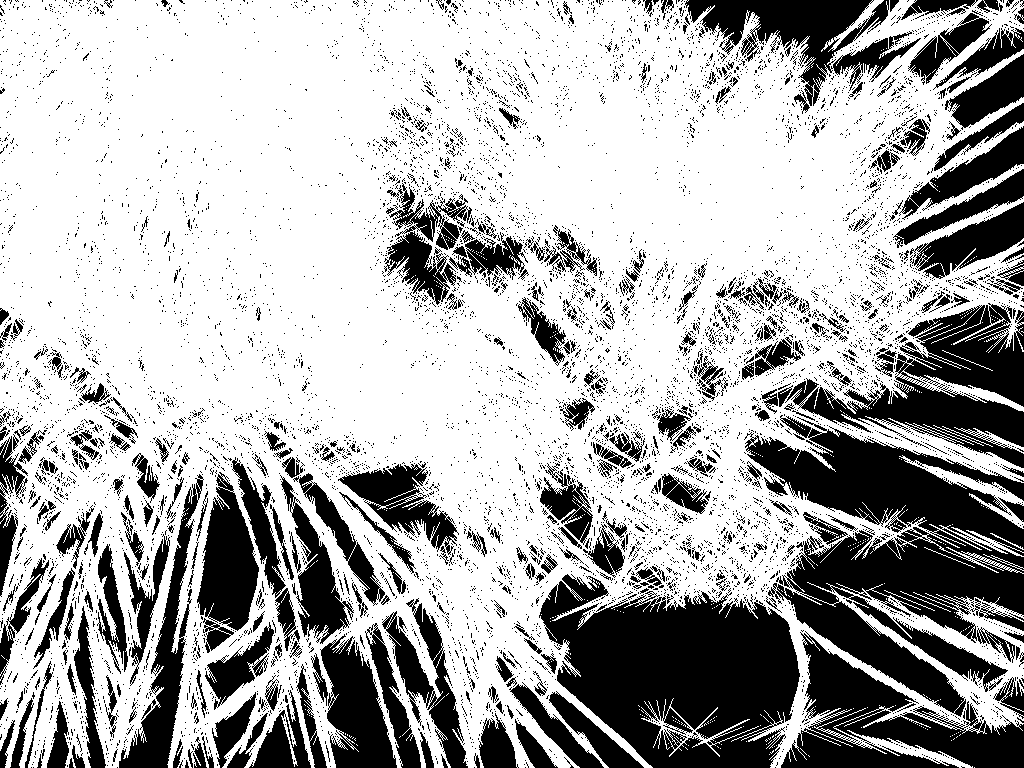
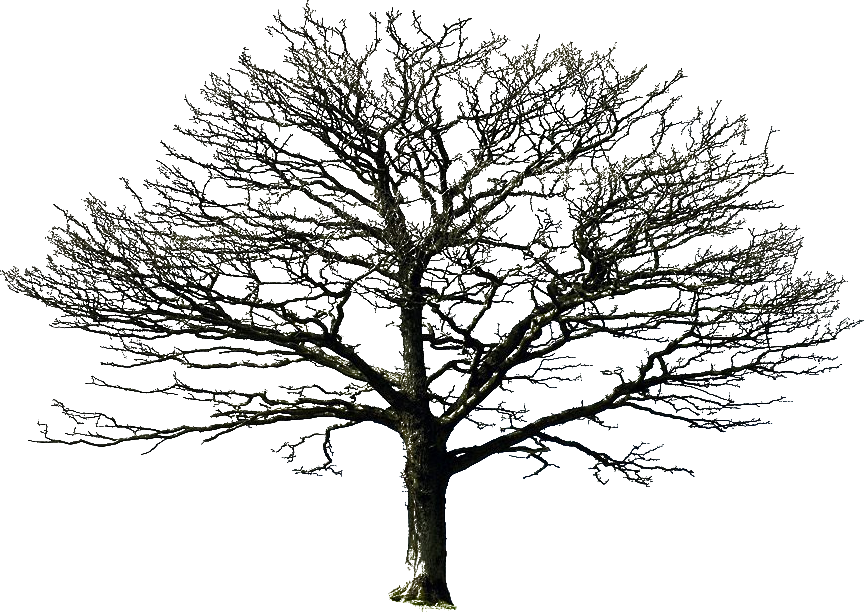
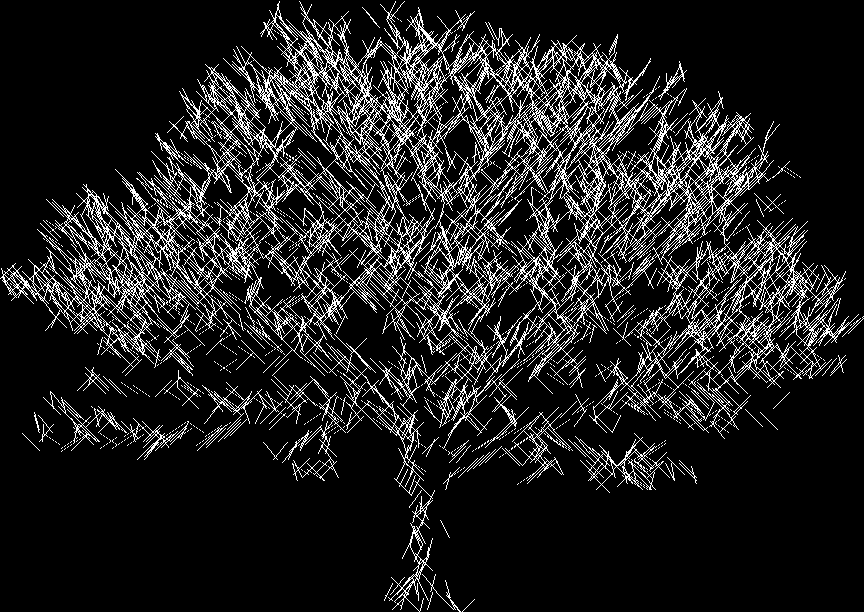
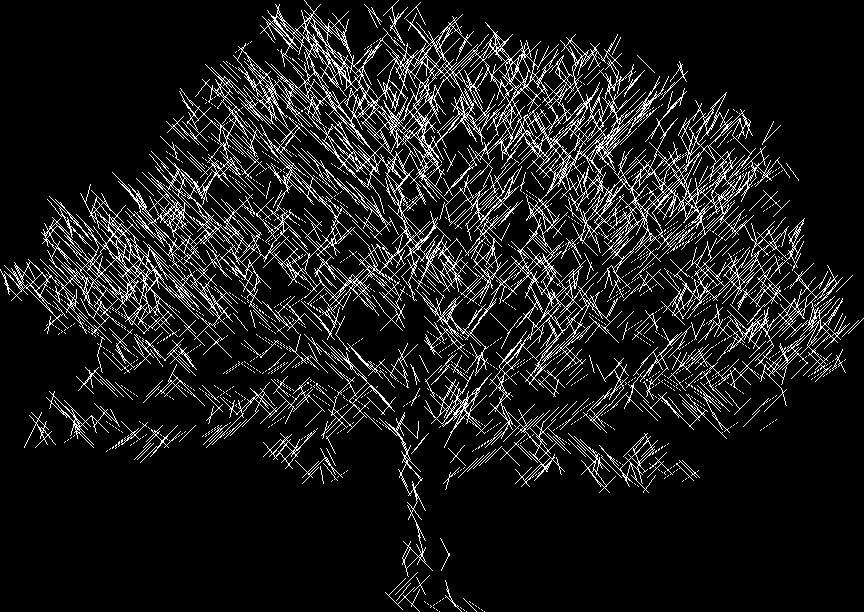
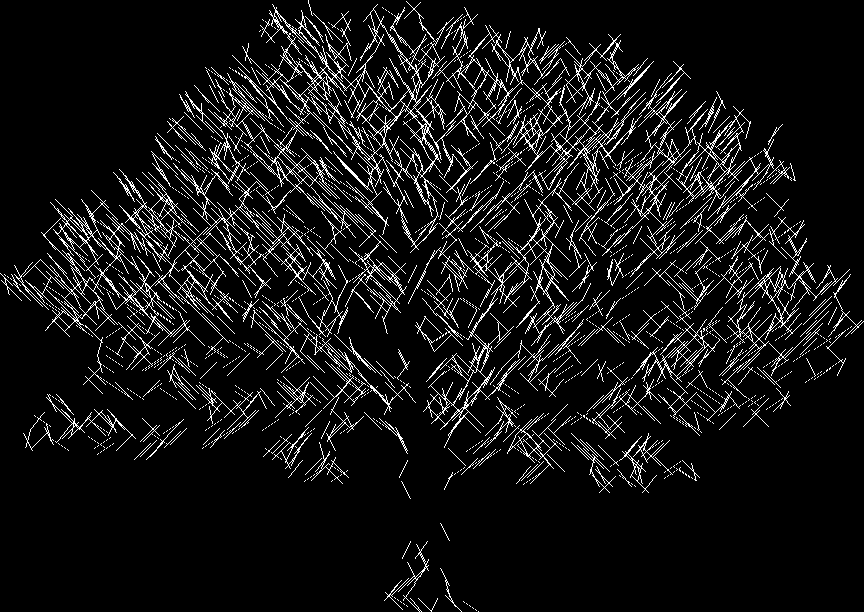
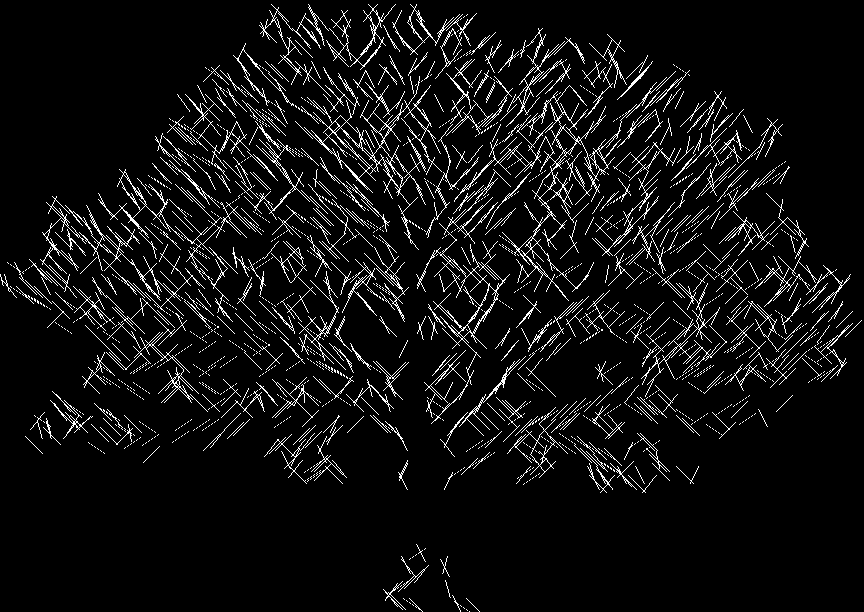
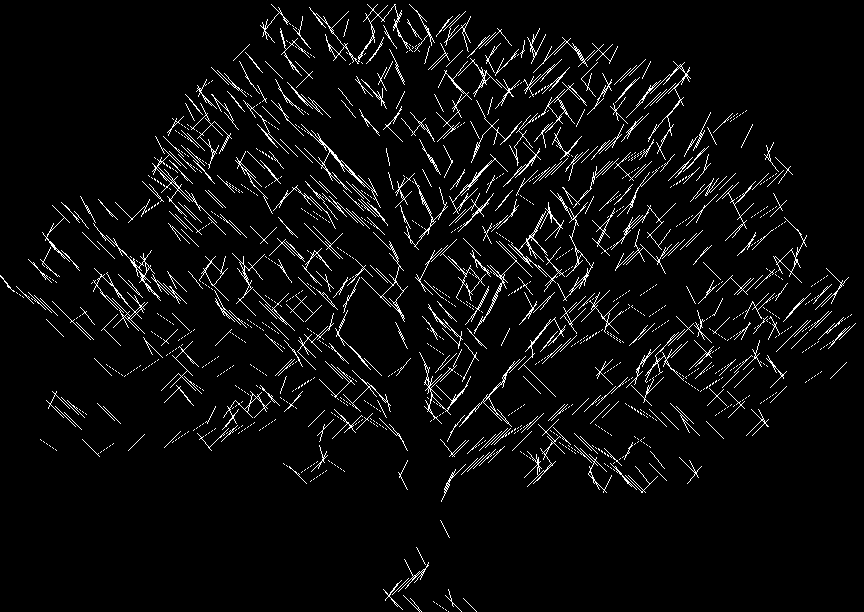
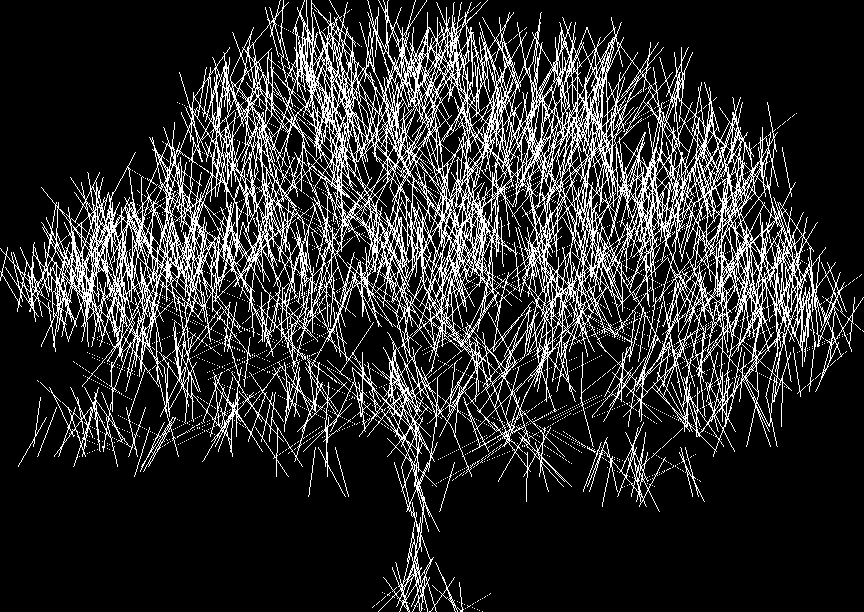
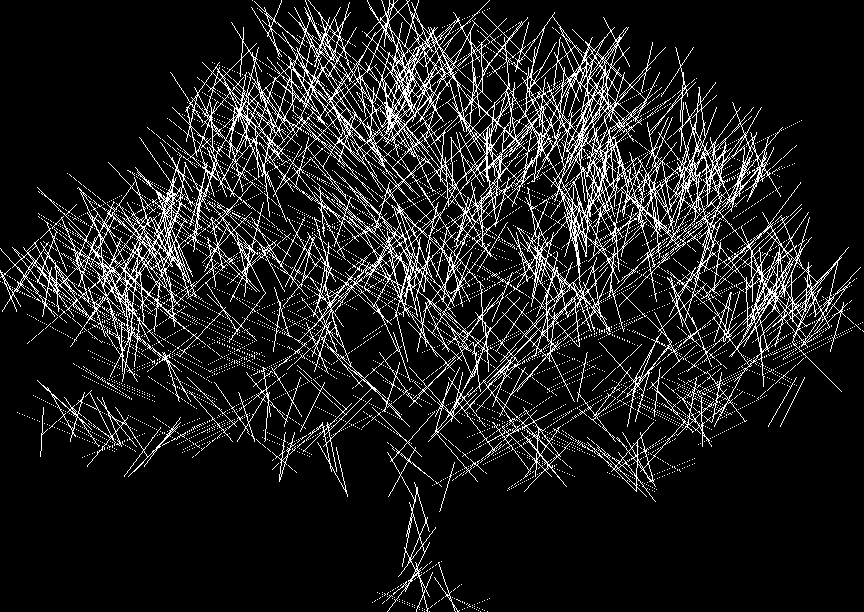
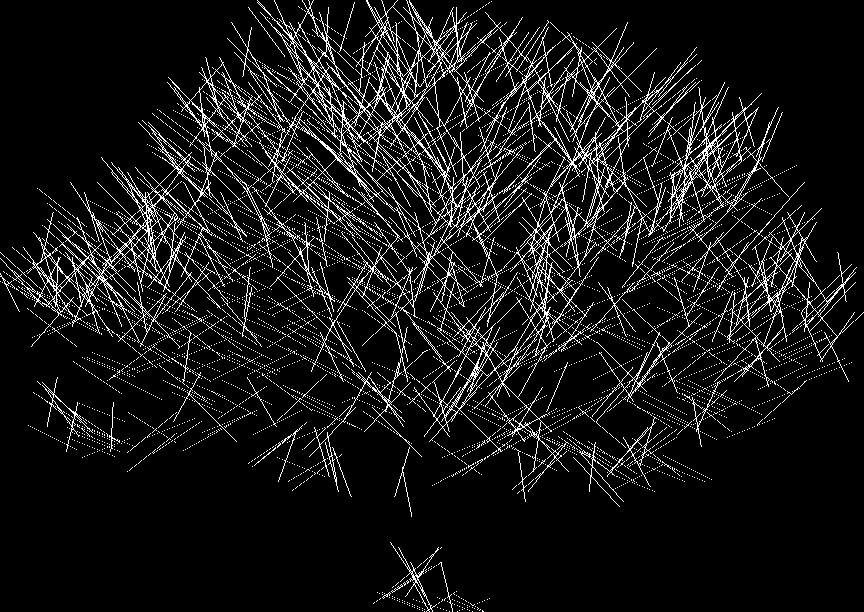
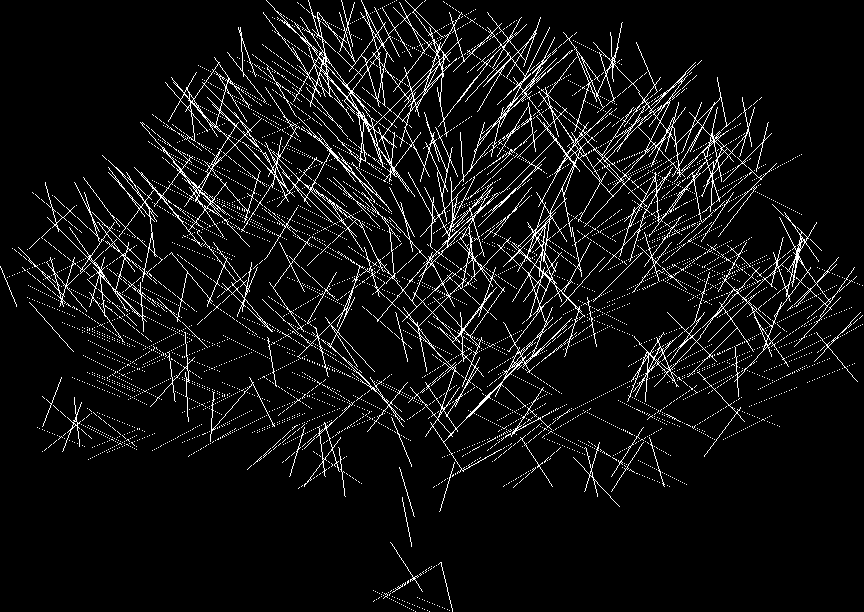
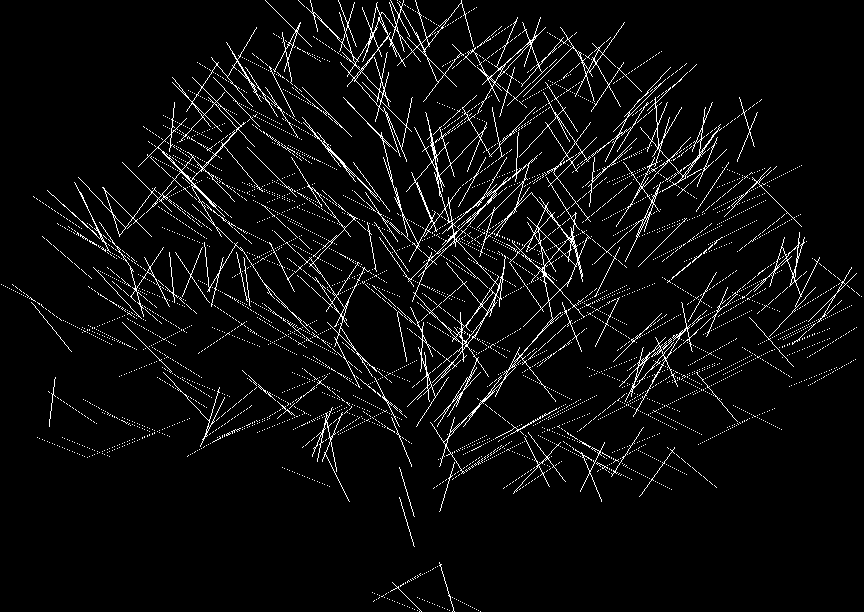
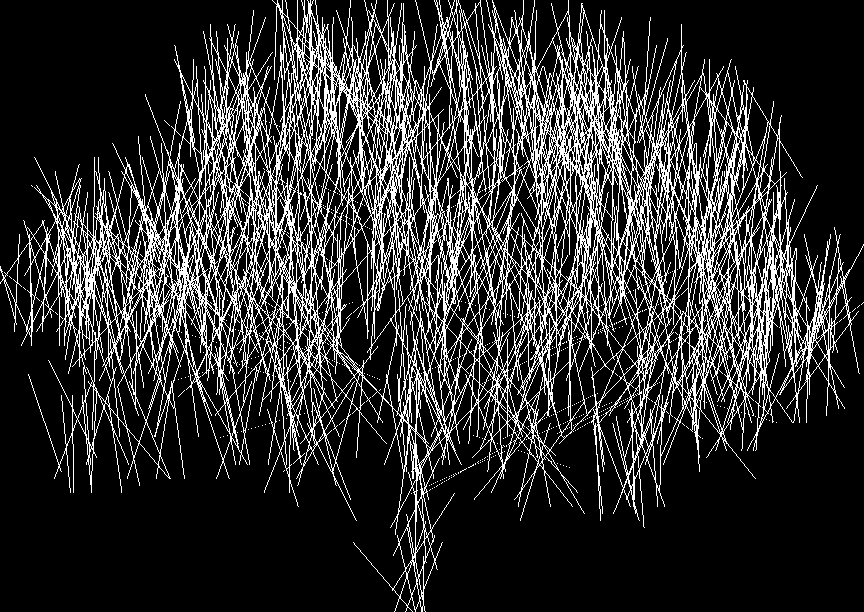
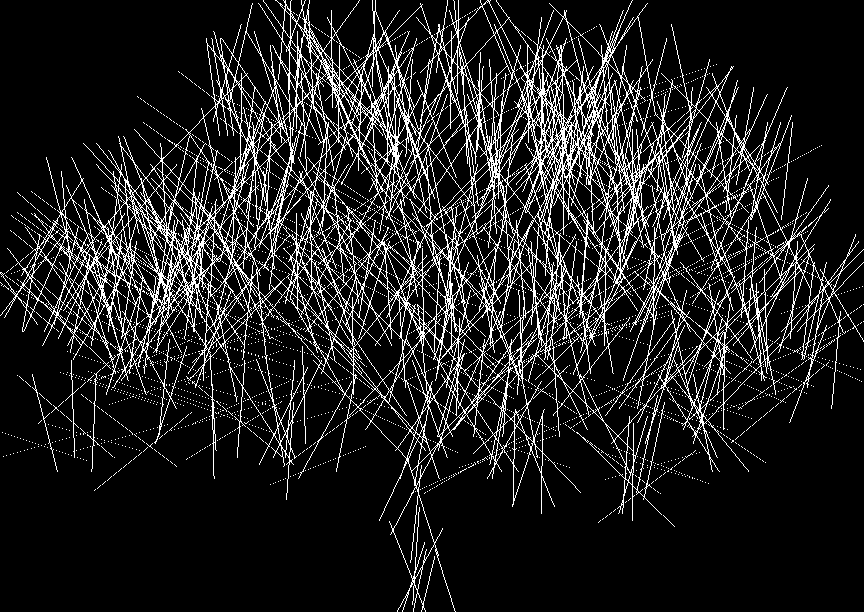
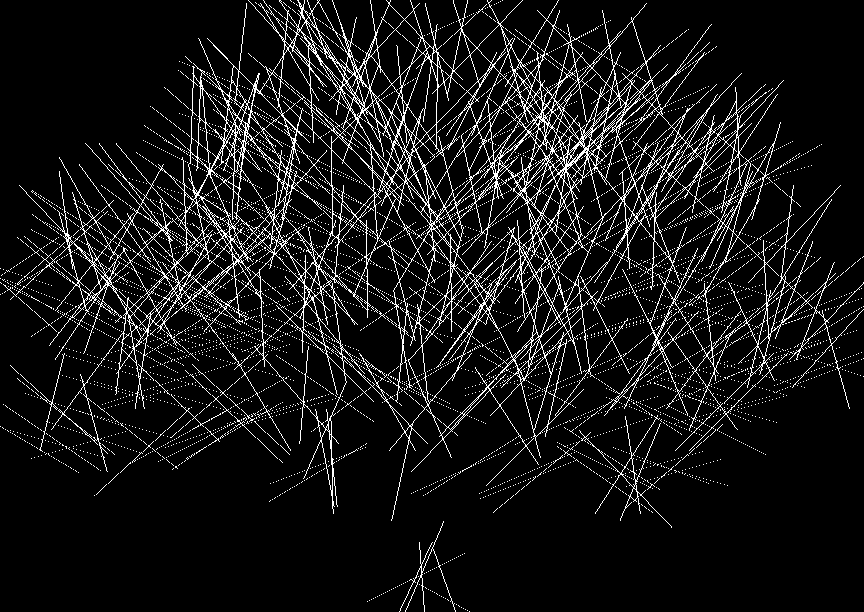
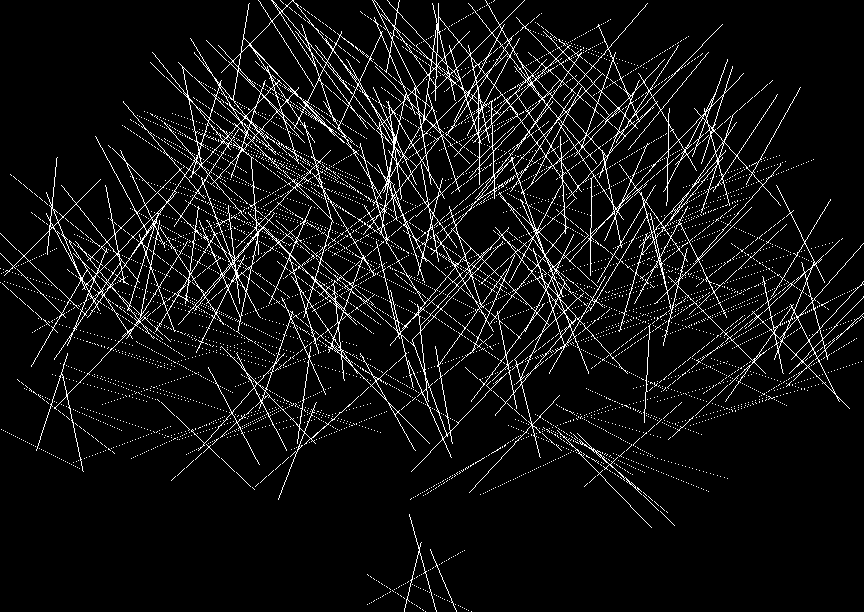
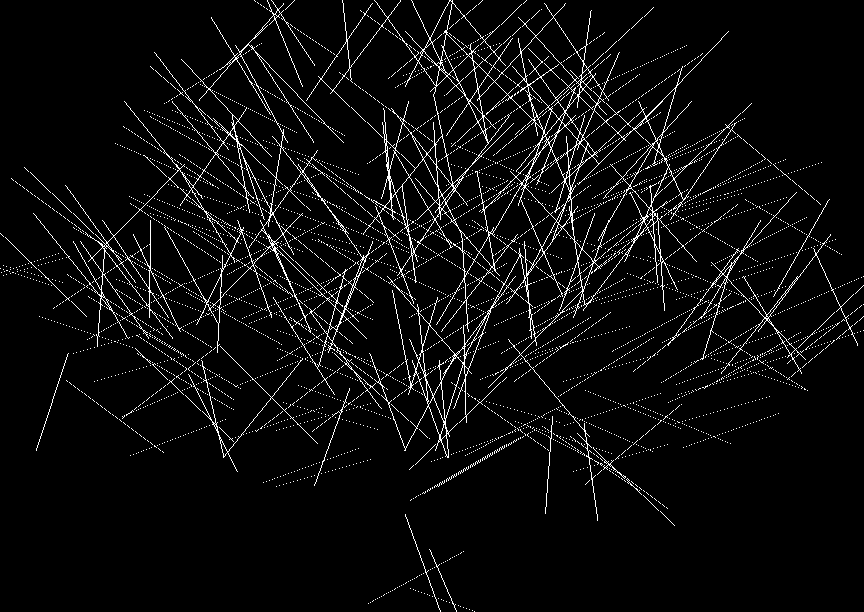
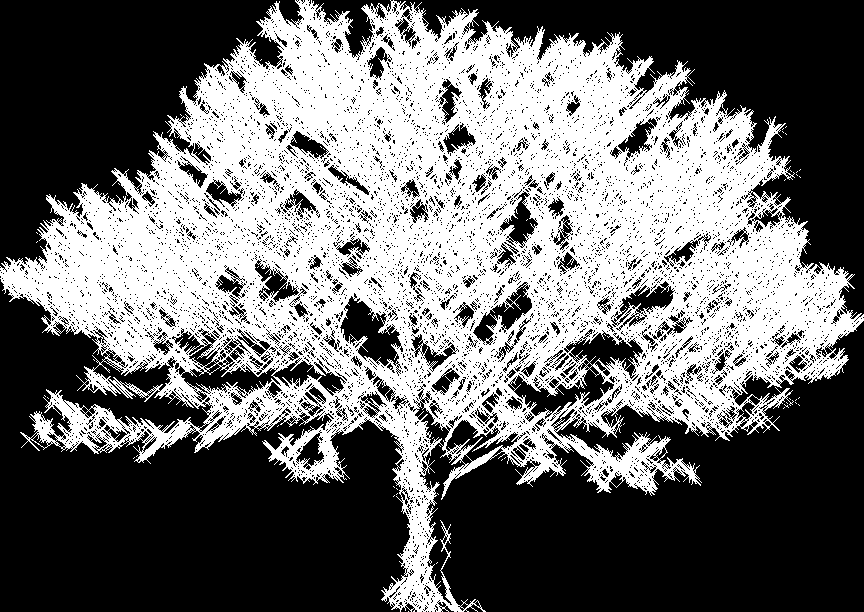
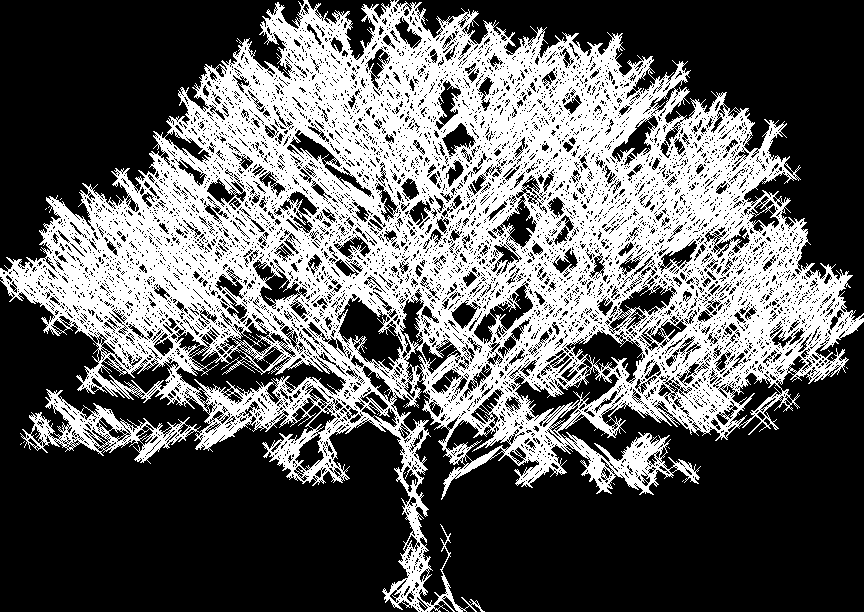
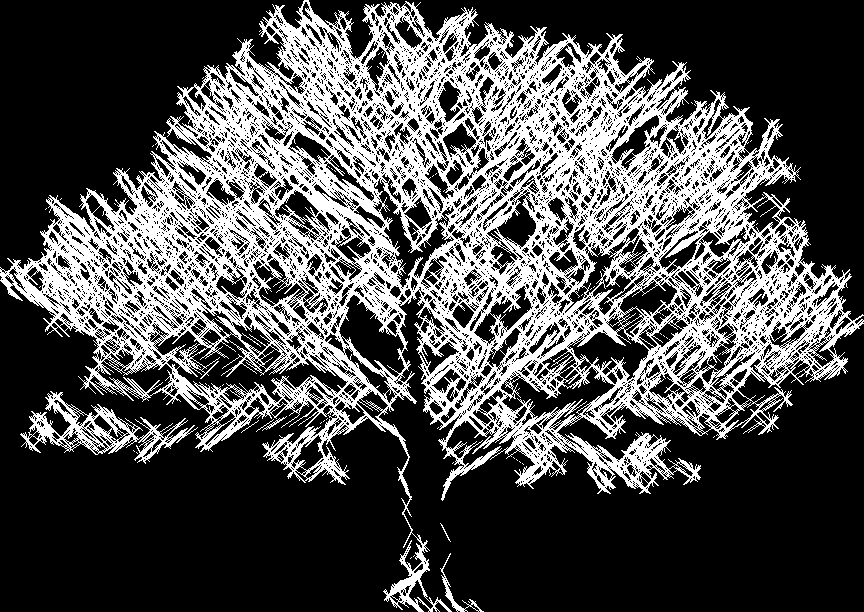
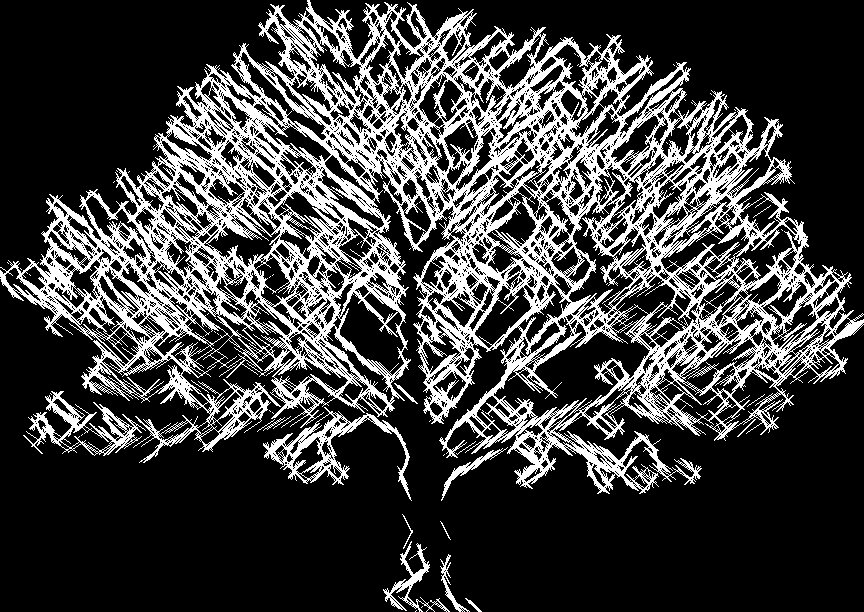
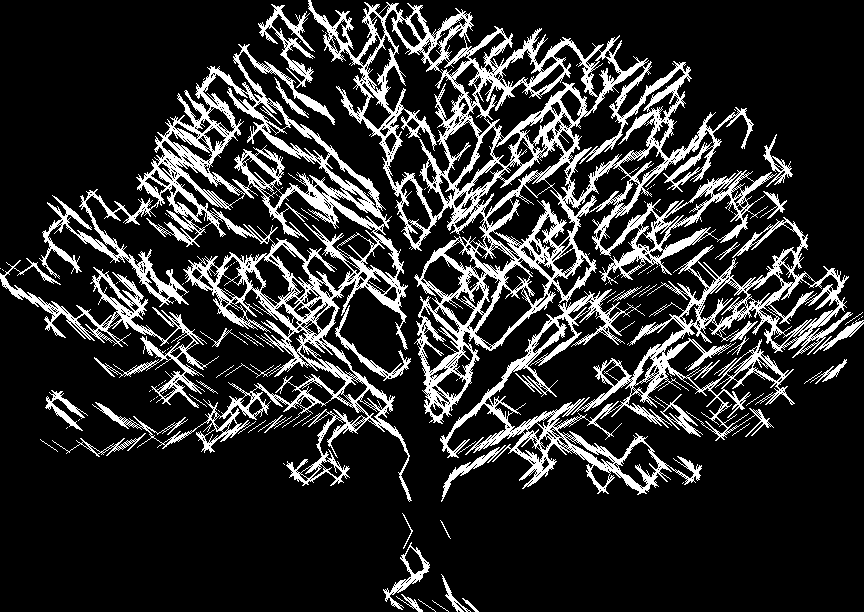
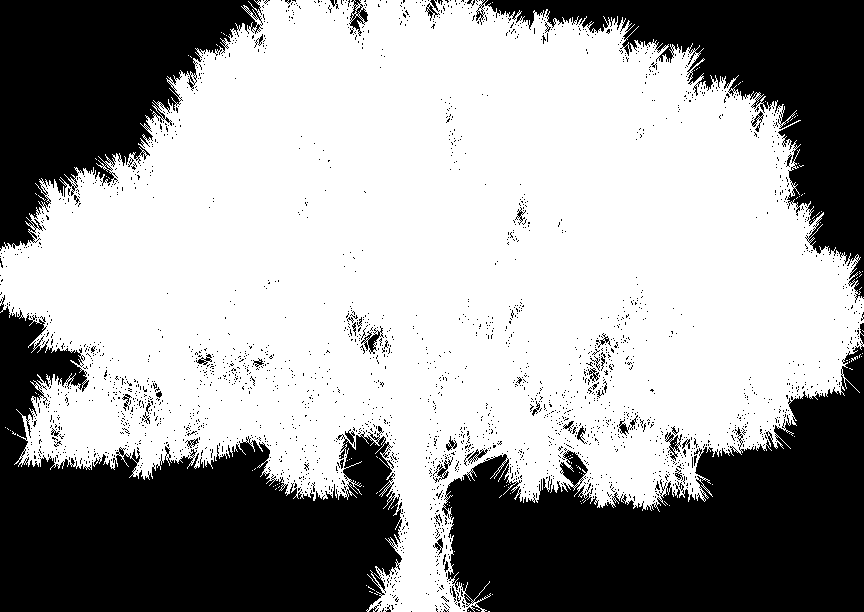
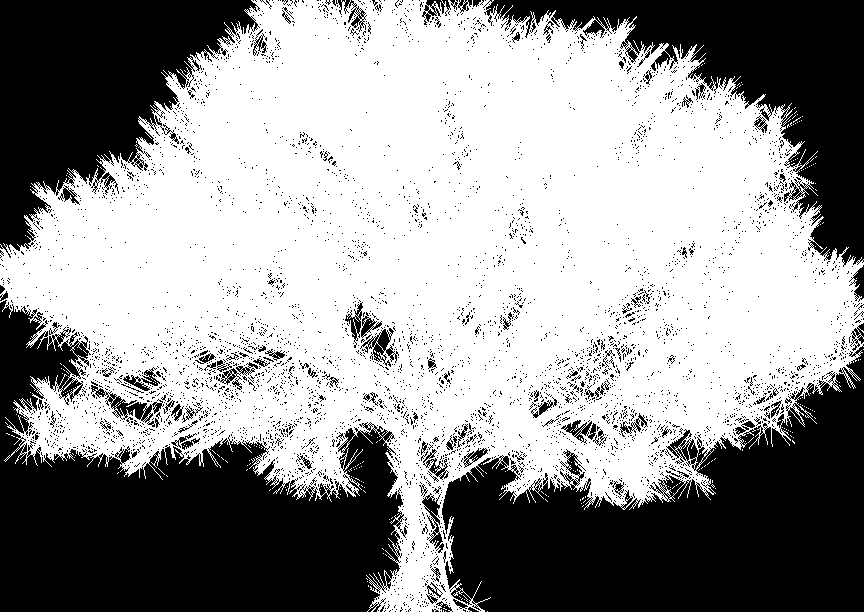
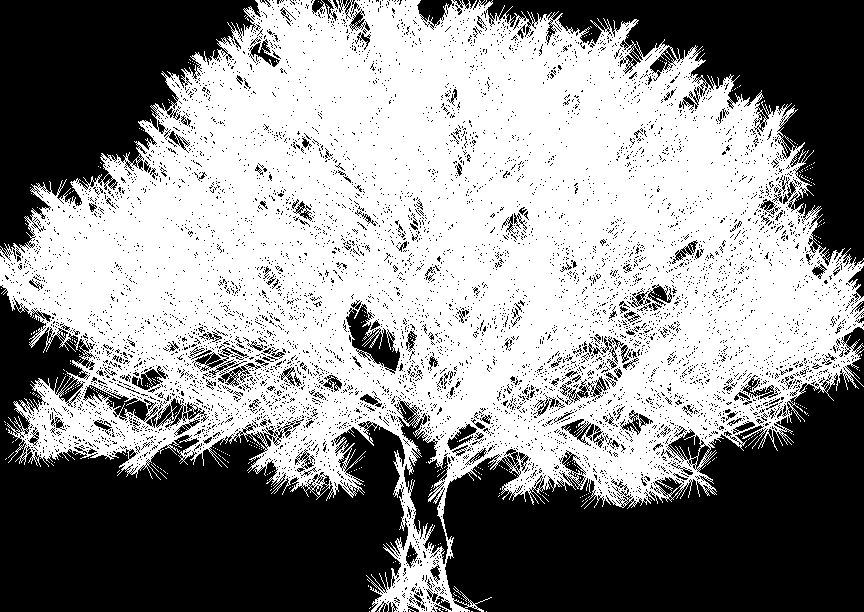
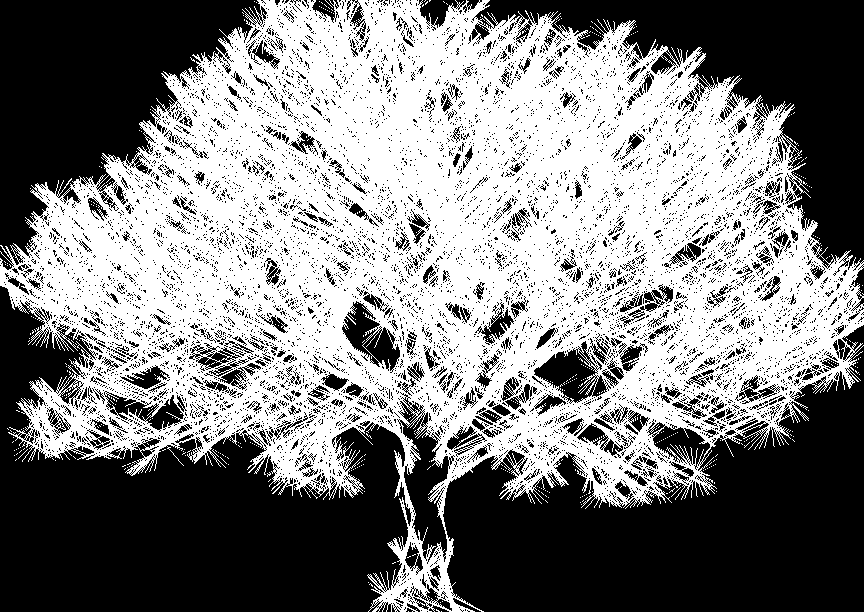
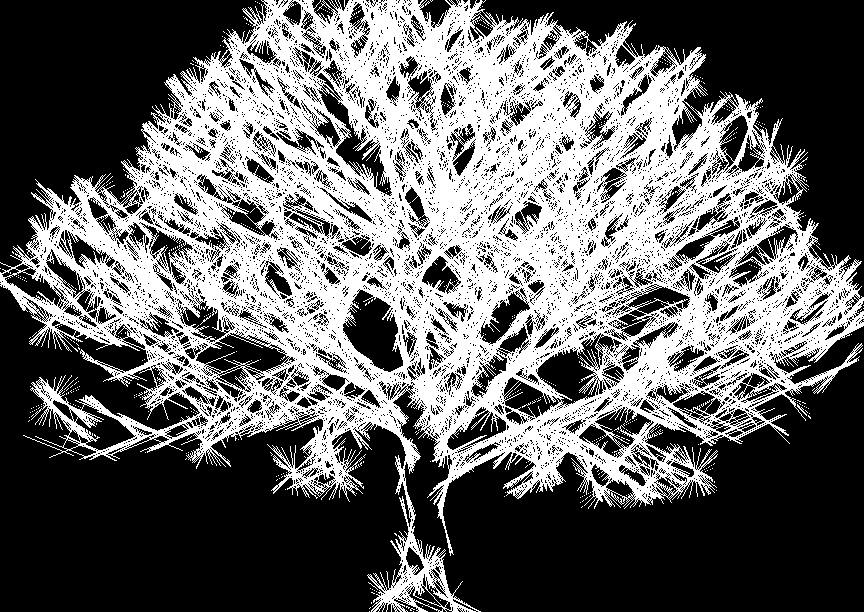
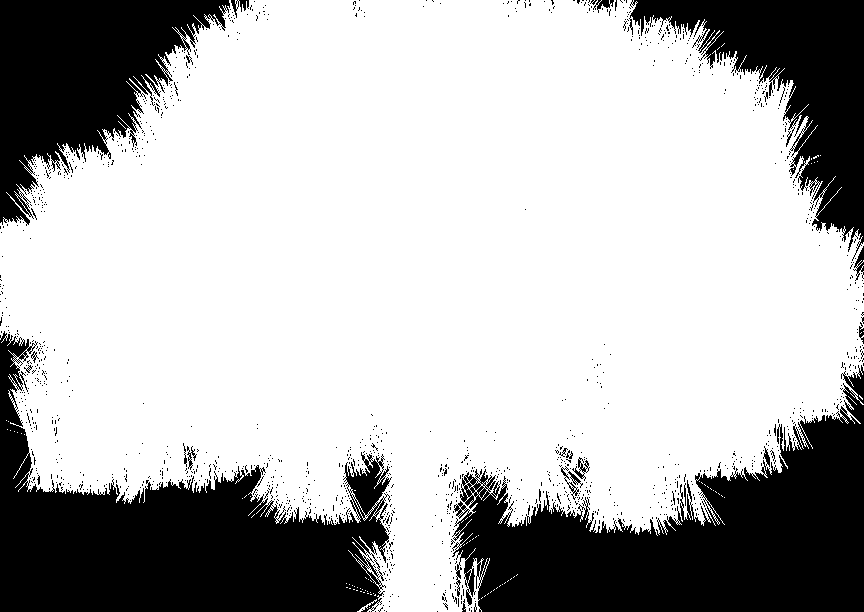
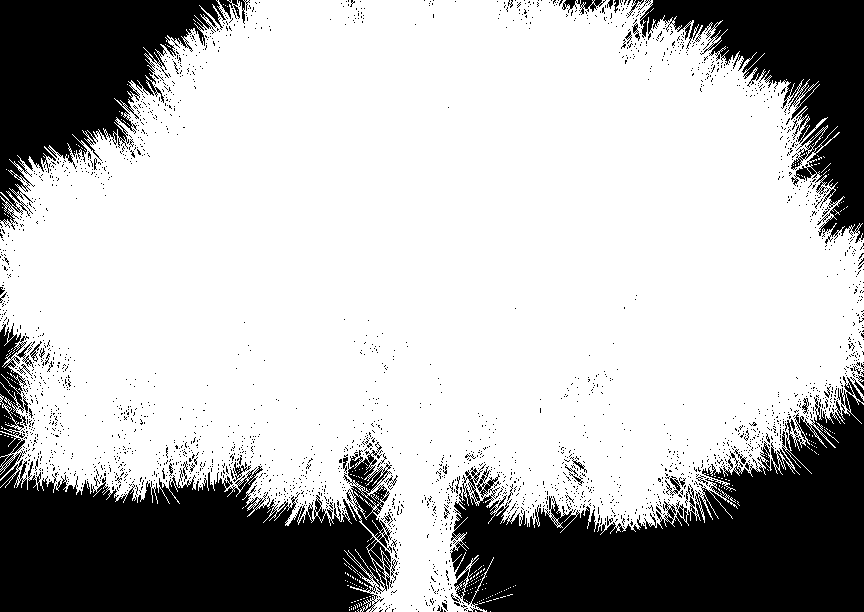
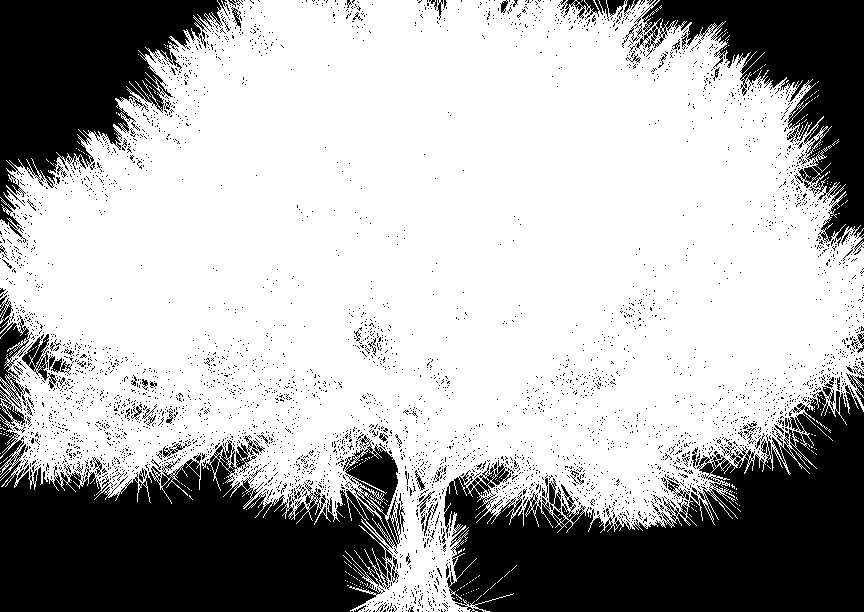
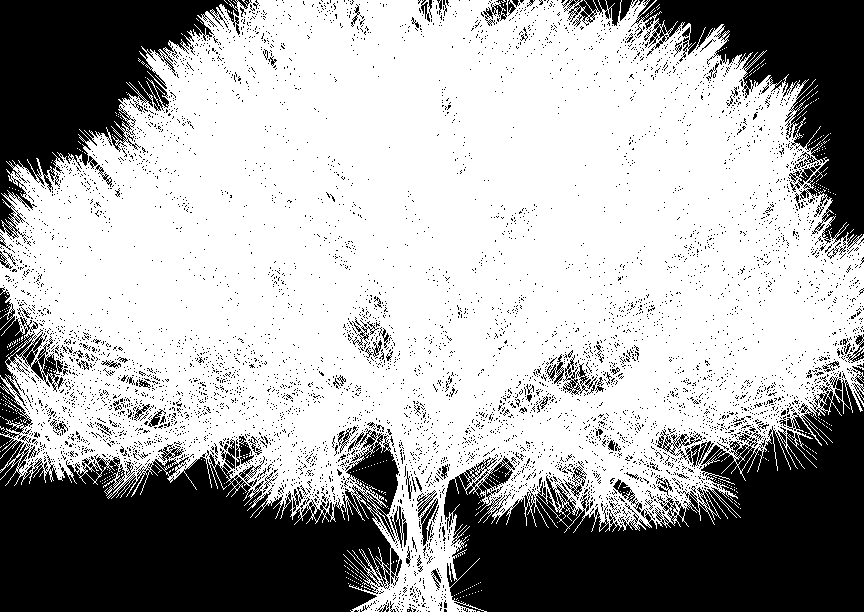
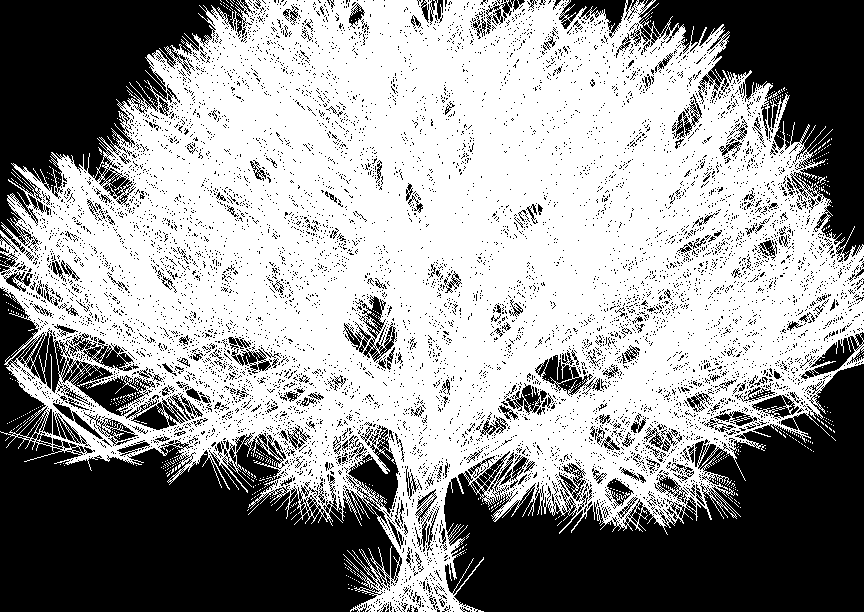
Below we have the output of applying this filter witih a variety of parameters to this image of a tree:
| Sigma = 1 | Sigma = 2 | Sigma = 3 | Sigma = 4 | Sigma = 5 | |
|---|---|---|---|---|---|
| N=3 |
|
|
|
|
|
| N=5 |
|
|
|
|
|
| N=7 |
|
|
|
|
|
| Sigma = 1 | Sigma = 2 | Sigma = 3 | Sigma = 4 | Sigma = 5 | |
|---|---|---|---|---|---|
| N=3 |
|
|
|
|
|
| N=5 |
|
|
|
|
|
| N=7 |
|
|
|
|
|
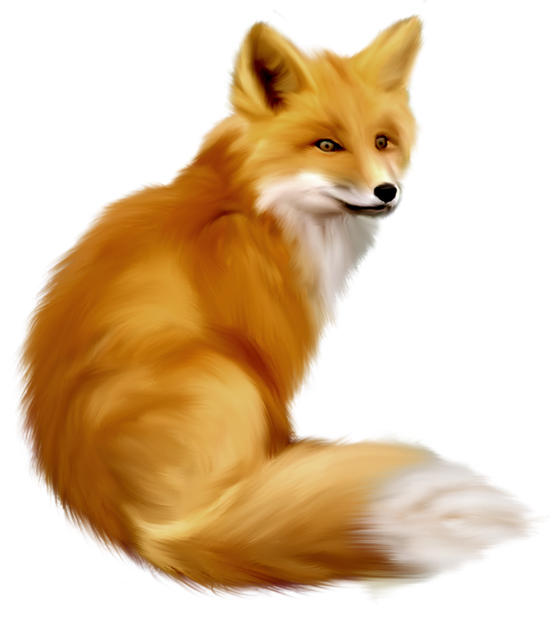
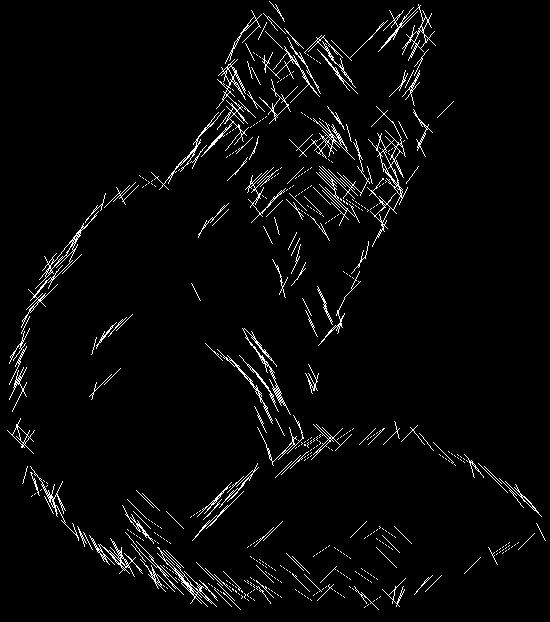
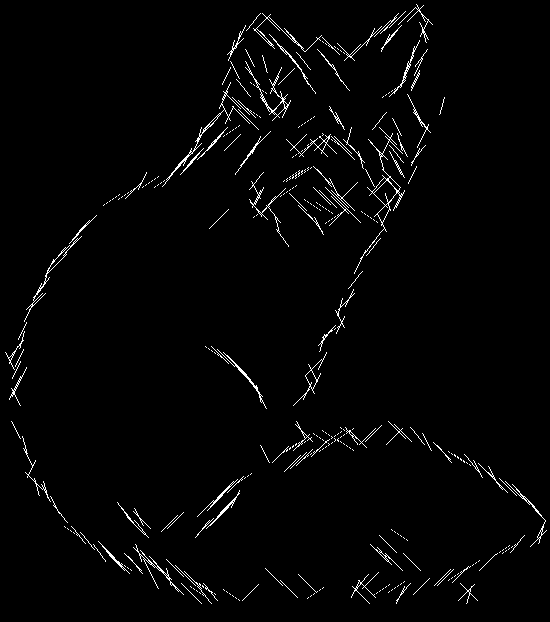
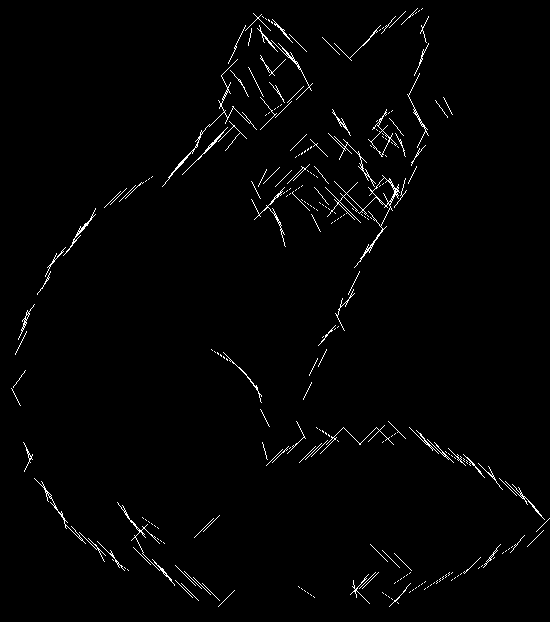
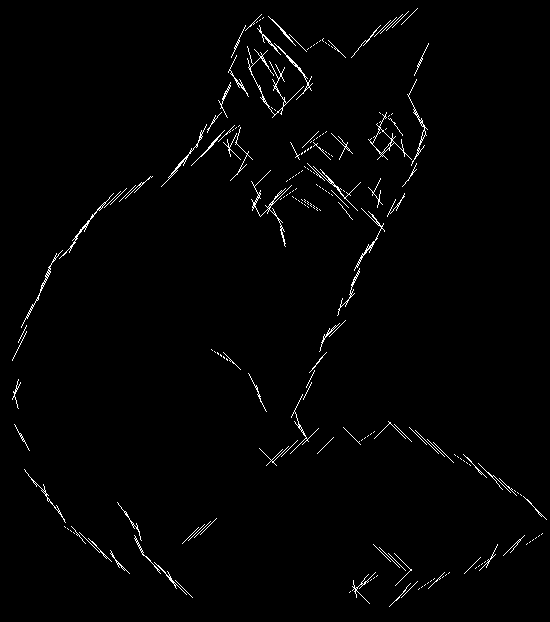
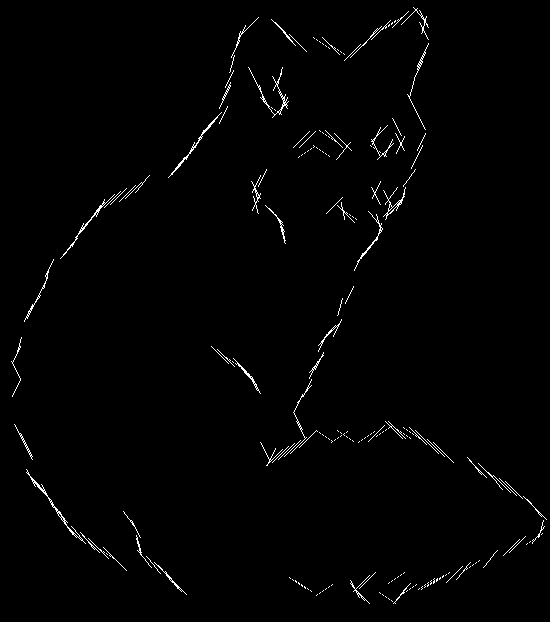
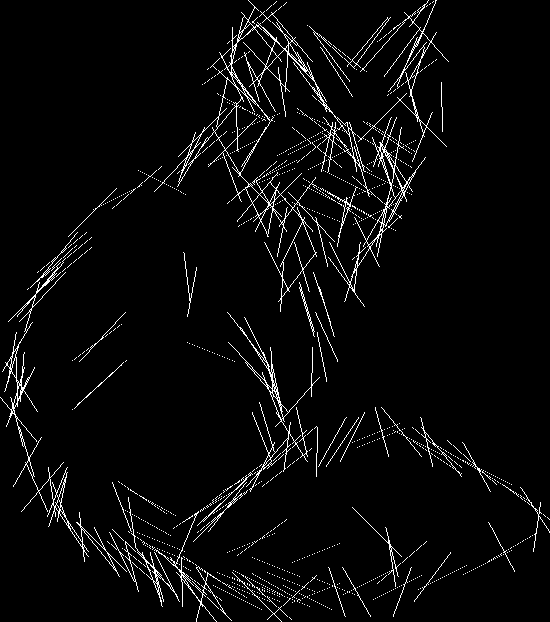
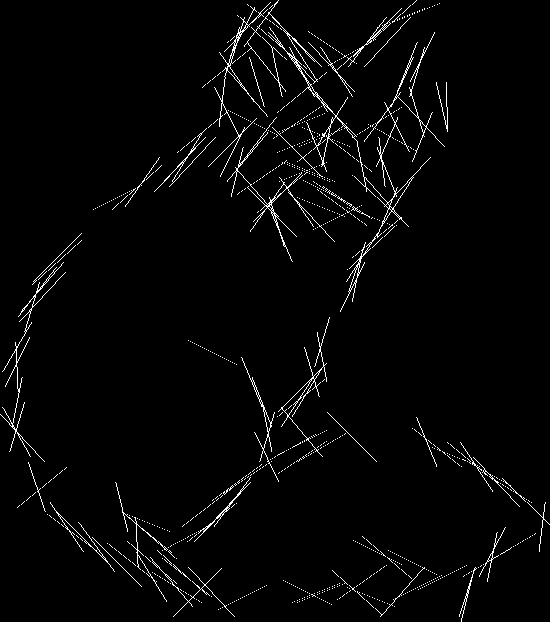
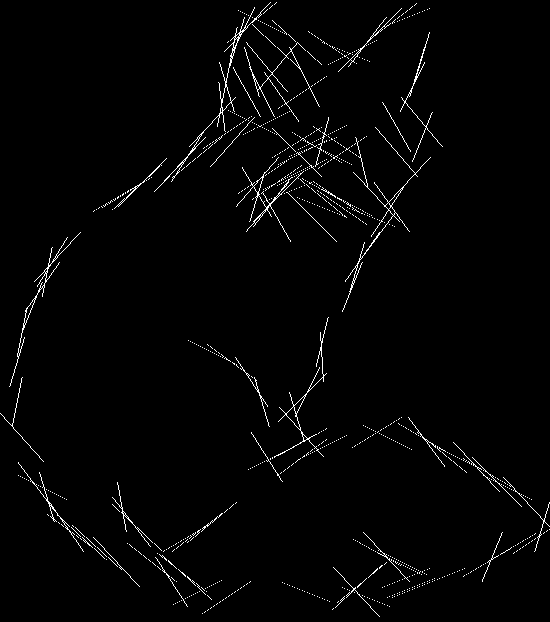
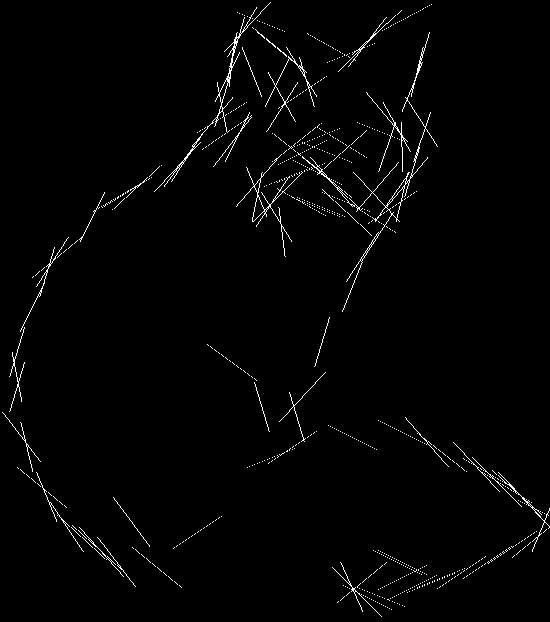
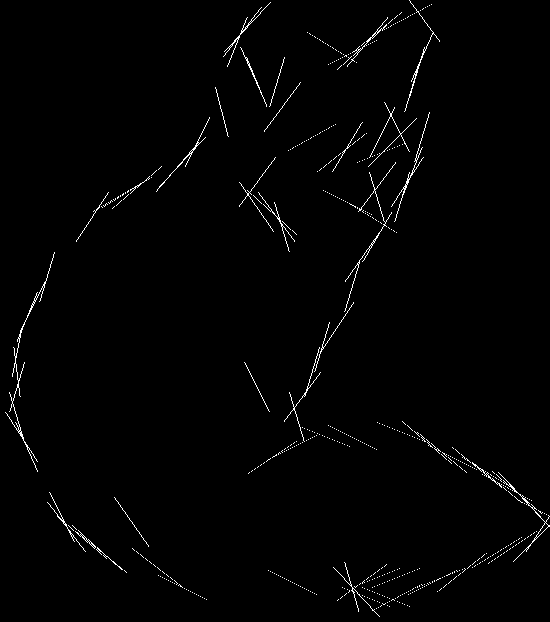
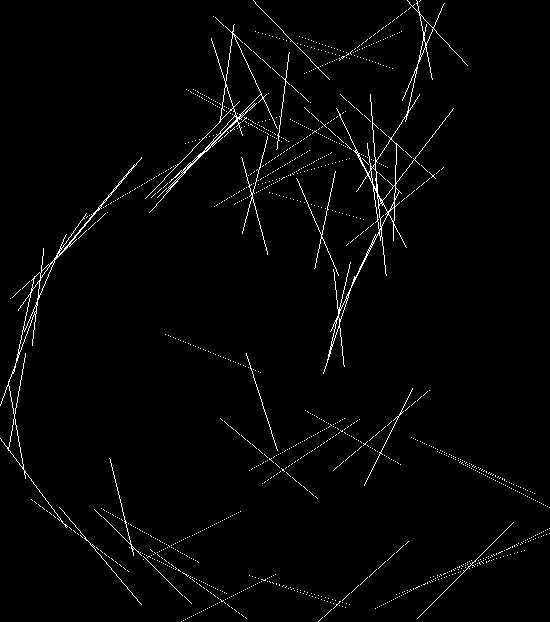
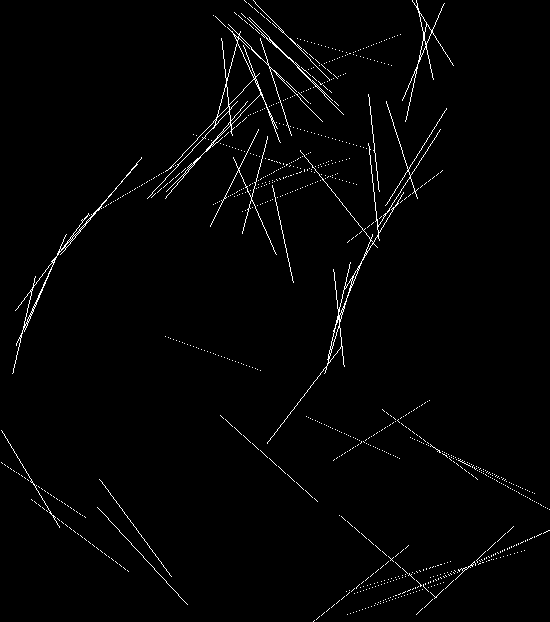
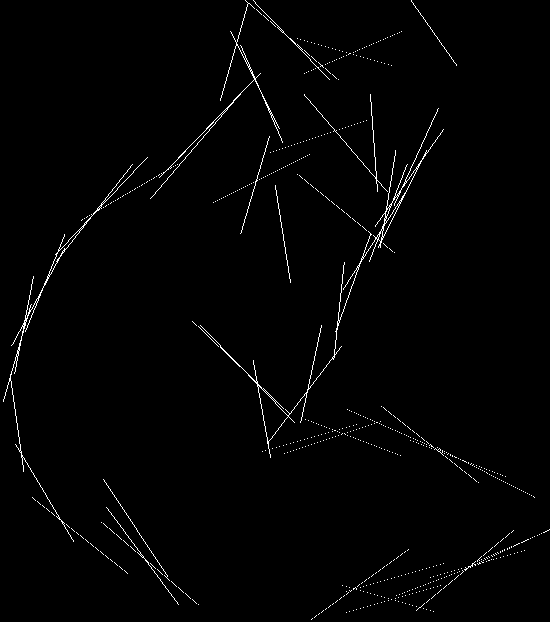
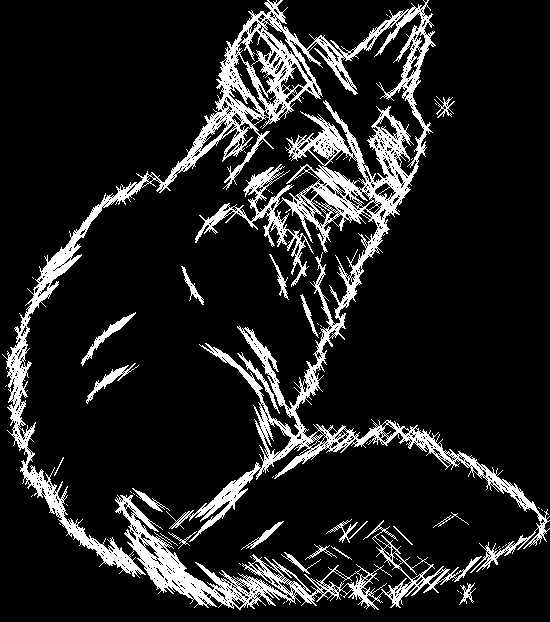
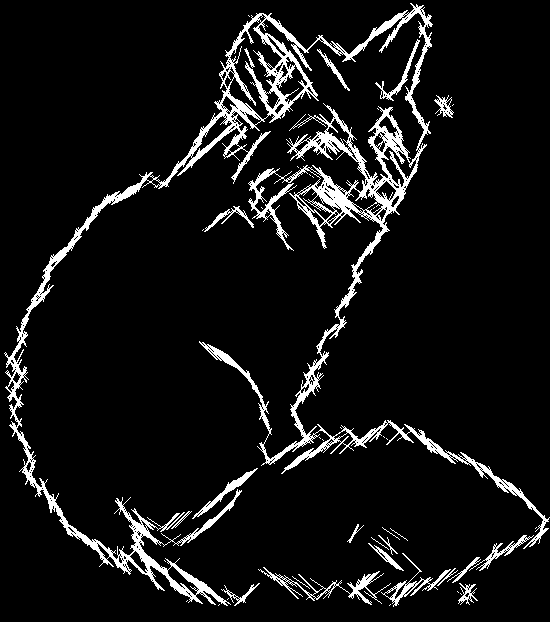
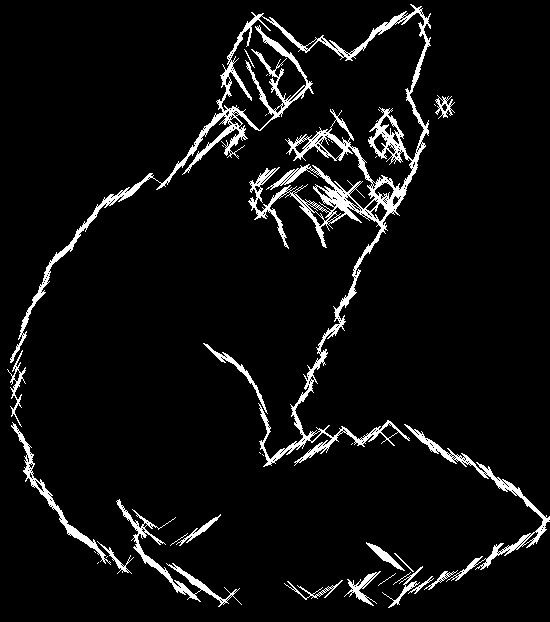
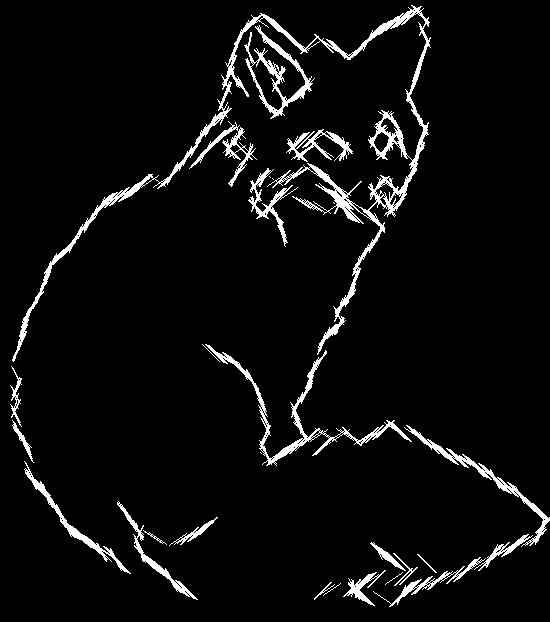
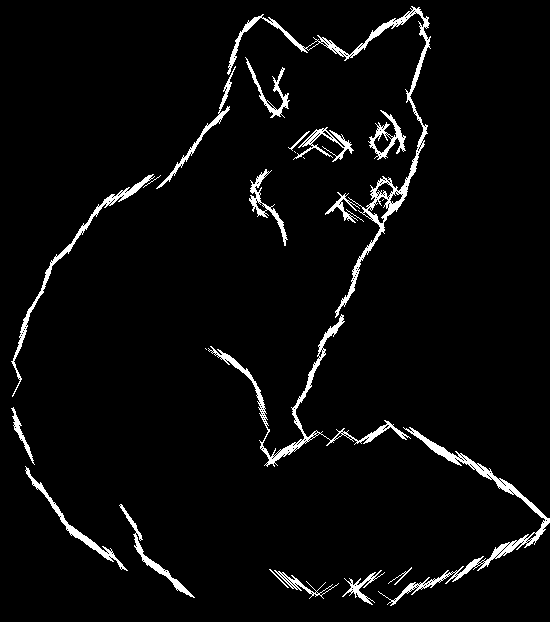
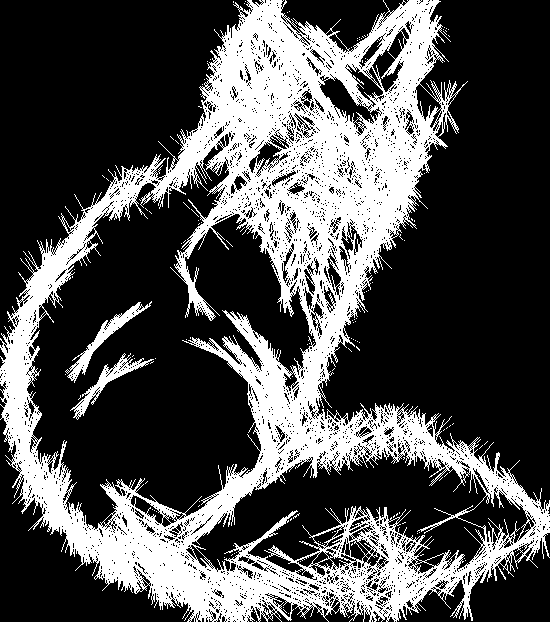
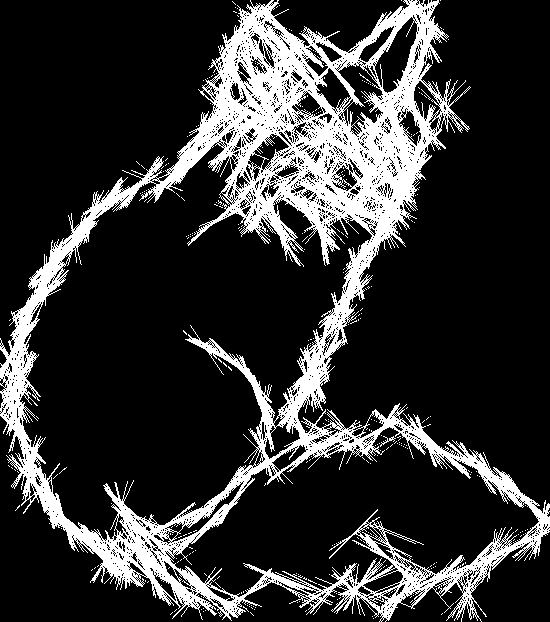
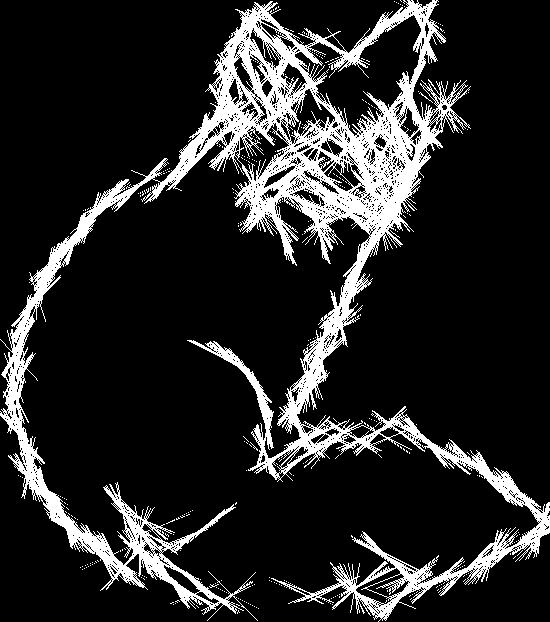
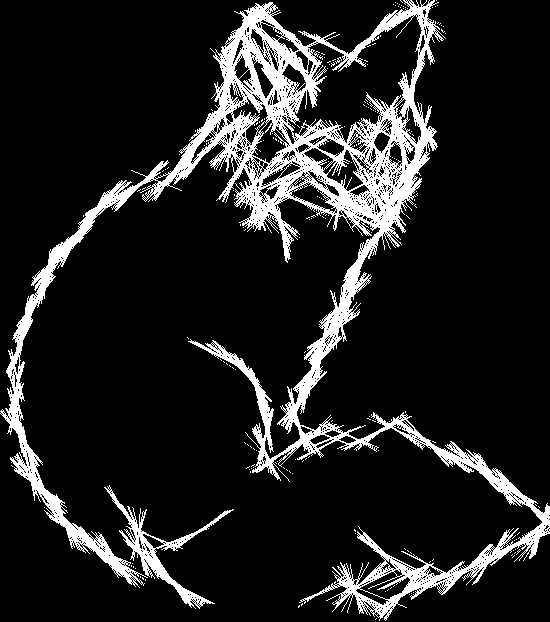
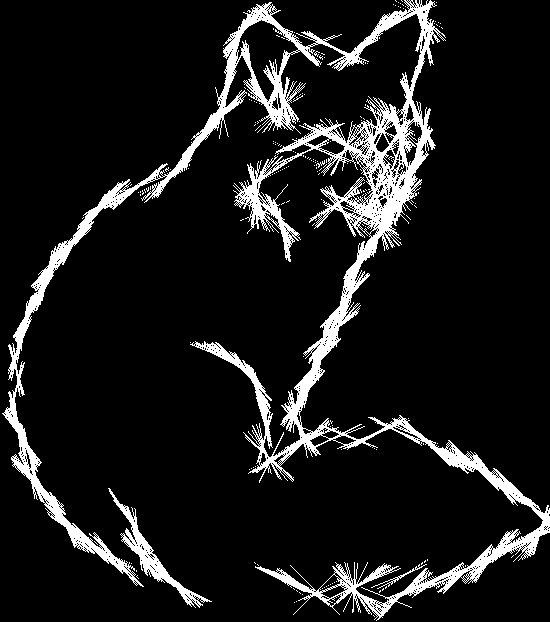
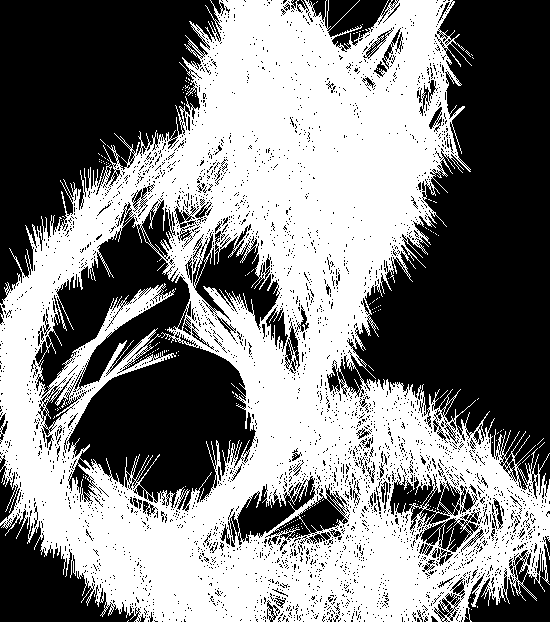
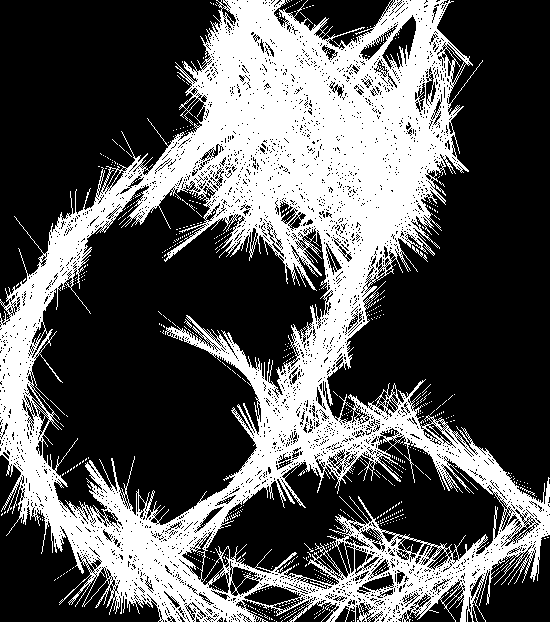
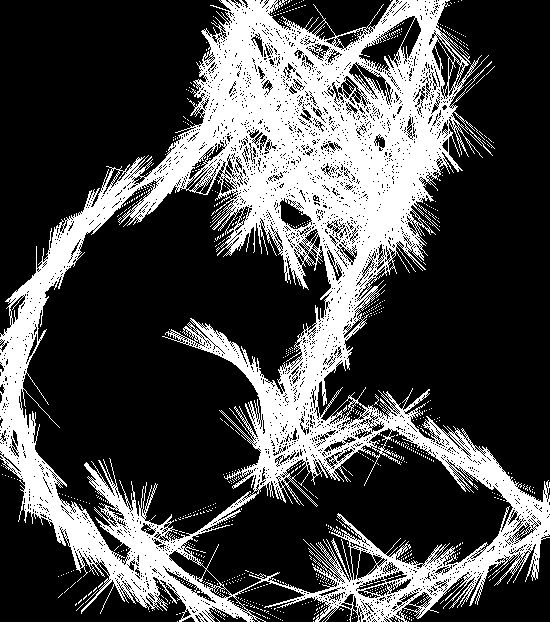
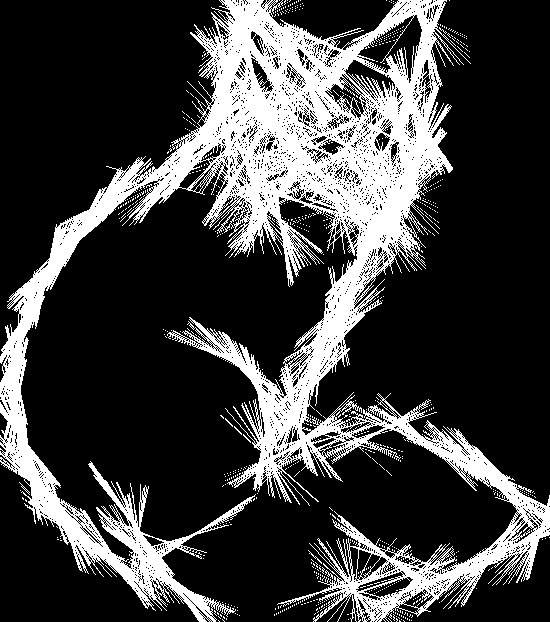
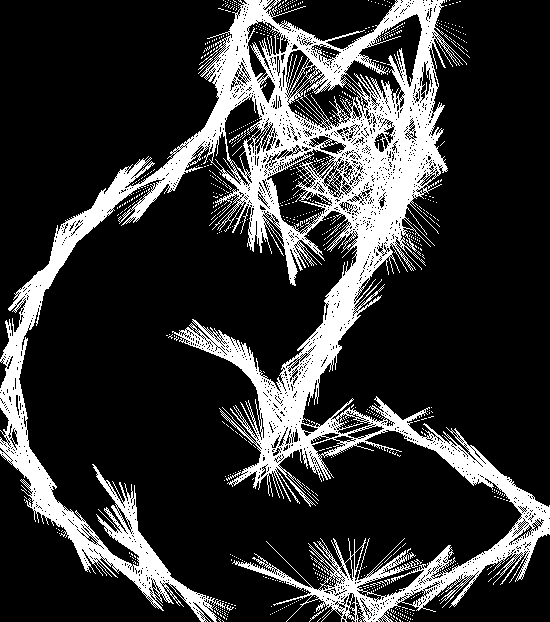
Below we have the output of applying this filter witih a variety of parameters to this image of a fox:
| Sigma = 1 | Sigma = 2 | Sigma = 3 | Sigma = 4 | Sigma = 5 | |
|---|---|---|---|---|---|
| N=3 |
|
|
|
|
|
| N=5 |
|
|
|
|
|
| N=7 |
|
|
|
|
|
| Sigma = 1 | Sigma = 2 | Sigma = 3 | Sigma = 4 | Sigma = 5 | |
|---|---|---|---|---|---|
| N=3 |
|
|
|
|
|
| N=5 |
|
|
|
|
|
| N=7 |
|
|
|
|
|
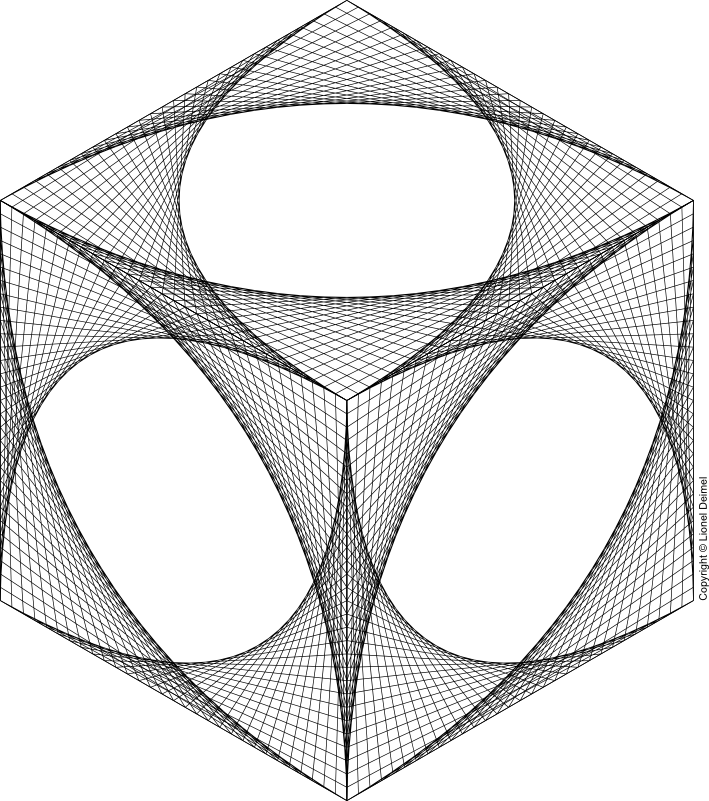
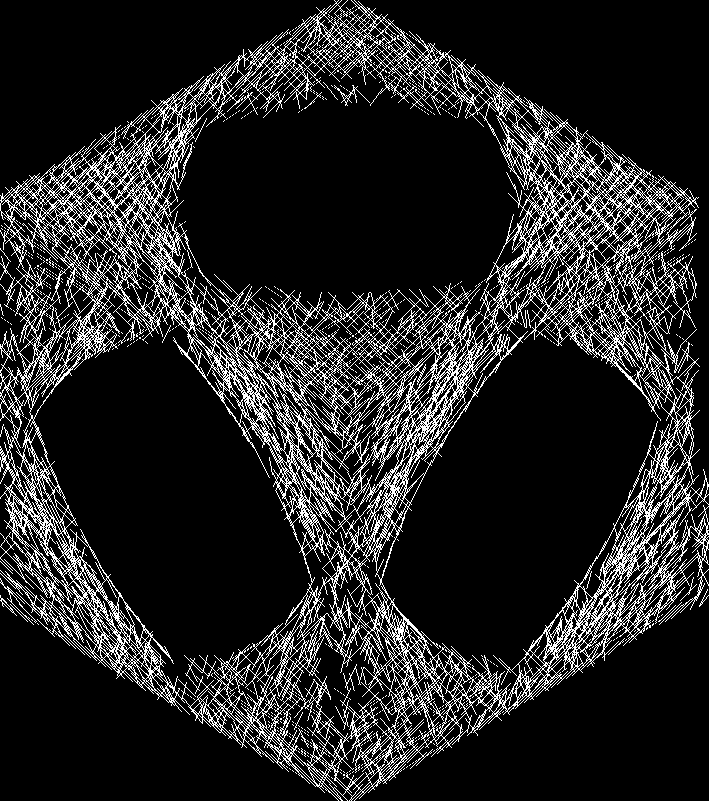
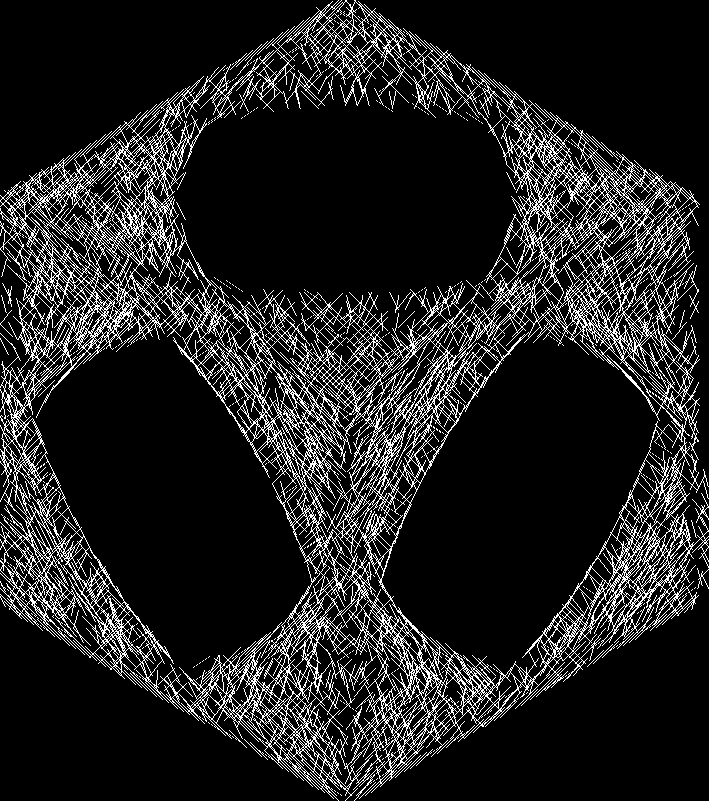
Below we have the output of applying this filter witih a variety of parameters to this image:

| Sigma = 1 | Sigma = 2 | Sigma = 3 | Sigma = 4 | Sigma = 5 | |
|---|---|---|---|---|---|
| N=3 |
|
|
|
|
|
| N=5 |
|
|
|
|
|
| N=7 |
|
|
|
|
|
| Sigma = 1 | Sigma = 2 | Sigma = 3 | Sigma = 4 | Sigma = 5 | |
|---|---|---|---|---|---|
| N=3 |
|
|
|
|
|
| N=5 |
|
|
|
|
|
| N=7 |
|
|
|
|
|
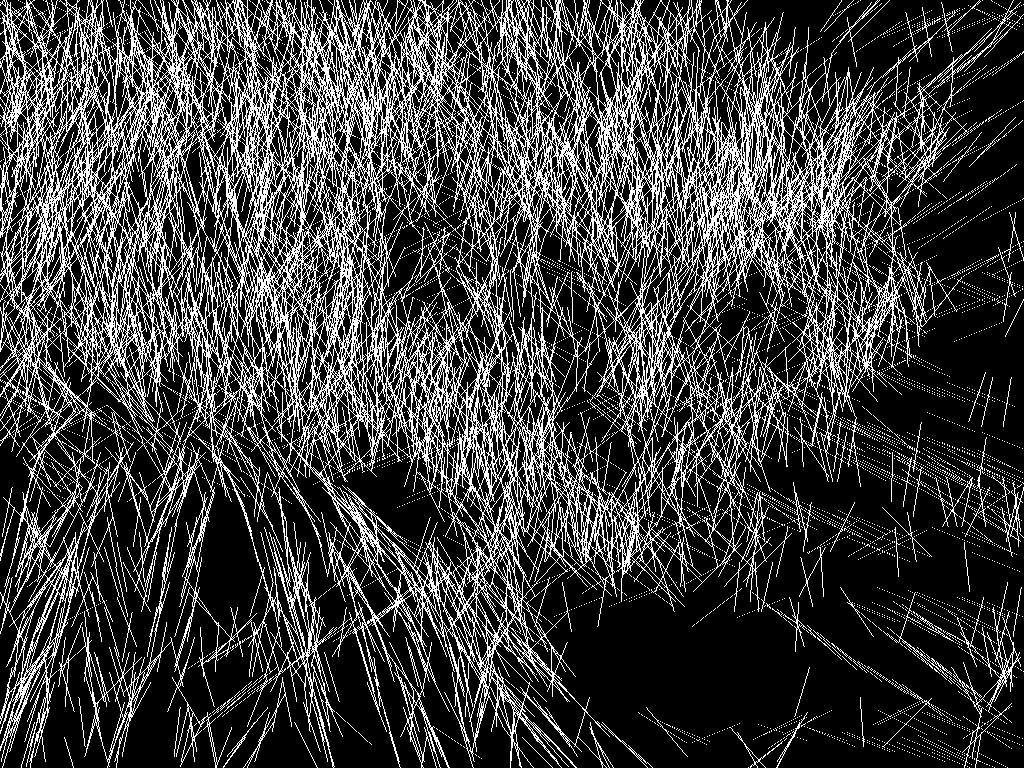
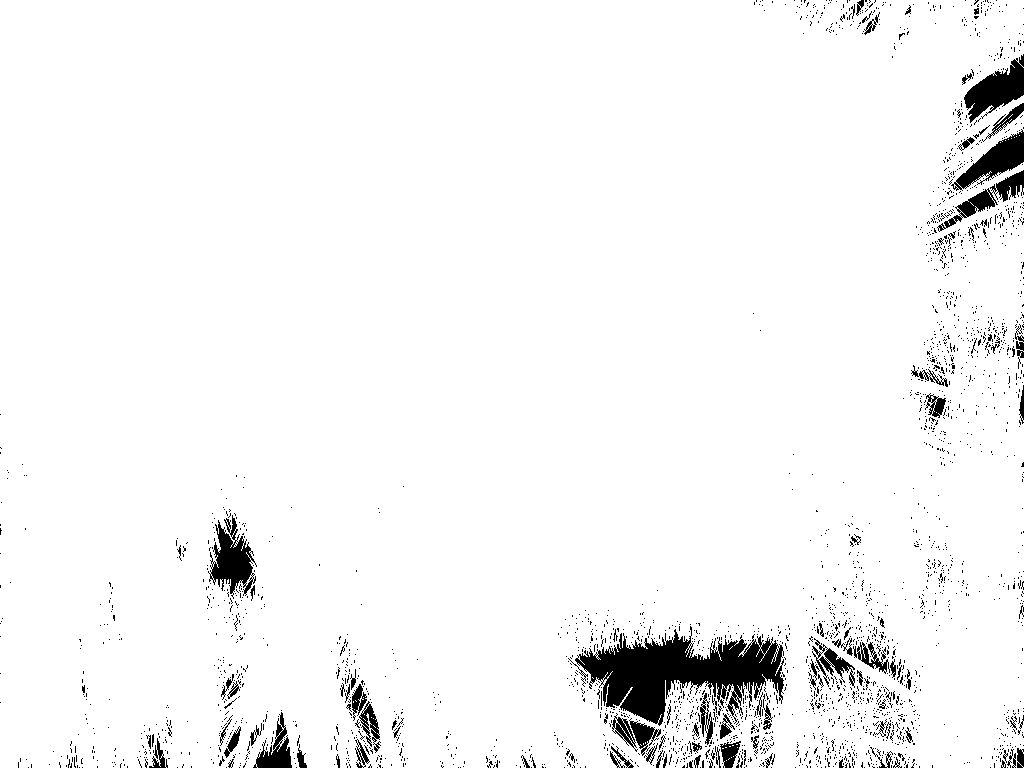
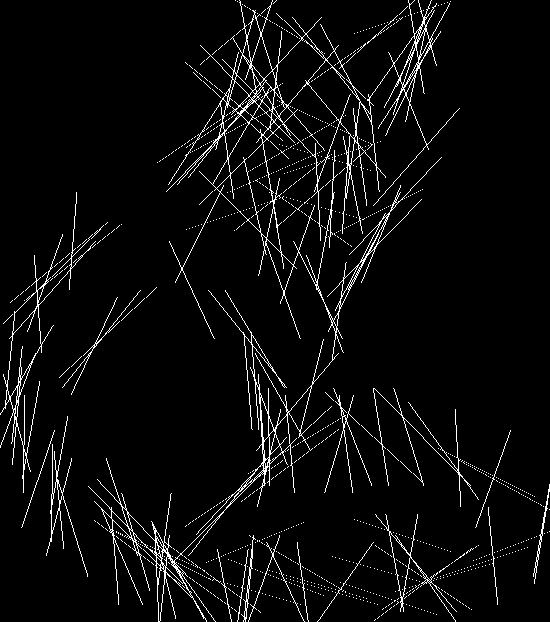
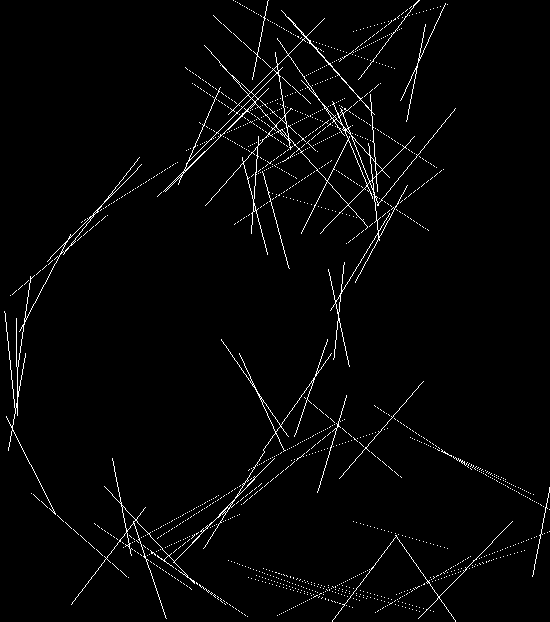
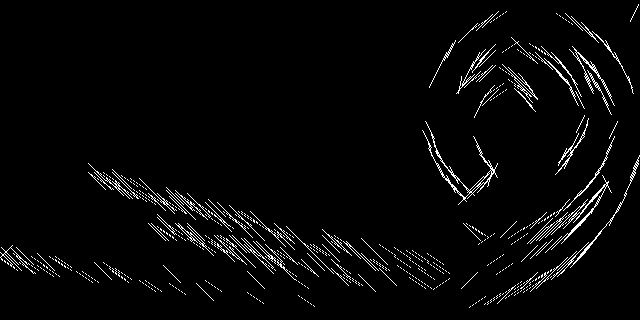
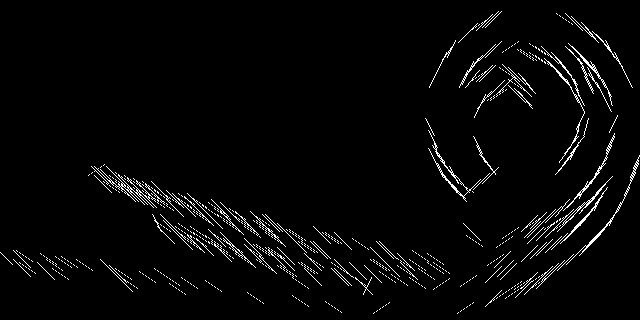
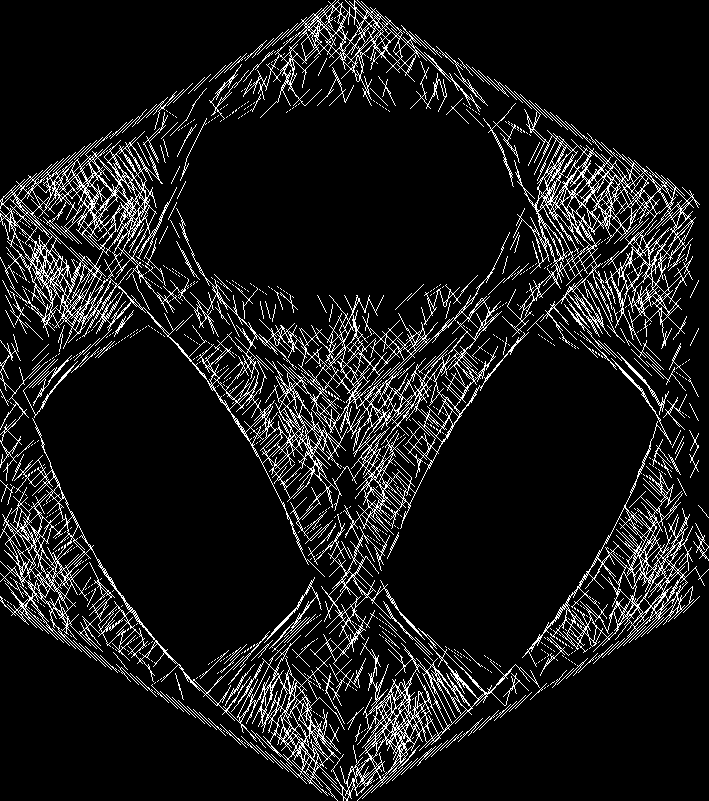
Below we have the output of applying this filter witih a variety of parameters to this image. This set is a good demonstration of the weaknesses of the linear regression method:
| Sigma = 1 | Sigma = 2 | Sigma = 3 | Sigma = 4 | Sigma = 5 | |
|---|---|---|---|---|---|
| N=3 |
|
|
|
|
|
| N=5 |
|
|
|
|
|
| N=7 |
|
|
|
|
|
| Sigma = 1 | Sigma = 2 | Sigma = 3 | Sigma = 4 | Sigma = 5 | |
|---|---|---|---|---|---|
| N=3 |
|
|
|
|
|
| N=5 |

|

|
|
|
|
| N=7 |
|
|

|
|
|